5

Many websites/experts claim that the longer you hold your assets, the likelier your asset's return is closer to that predicted by the compound interest formula.

However, some other experts claim that this is wrong based on the Modern Portfolio Theory and in fact the probability the asset growth will be at least that will decrease as you hold your assets longer.

The chart below essentially shows how the probability distribution of asset growth changes over time with a portfolio of an expected return = 0.05 and risk = 0.2. In this simulation, the probability of you getting at least the expected amount as per compound interest is 46% on first year, 42% on fifth year, 38% on tenth year etc.
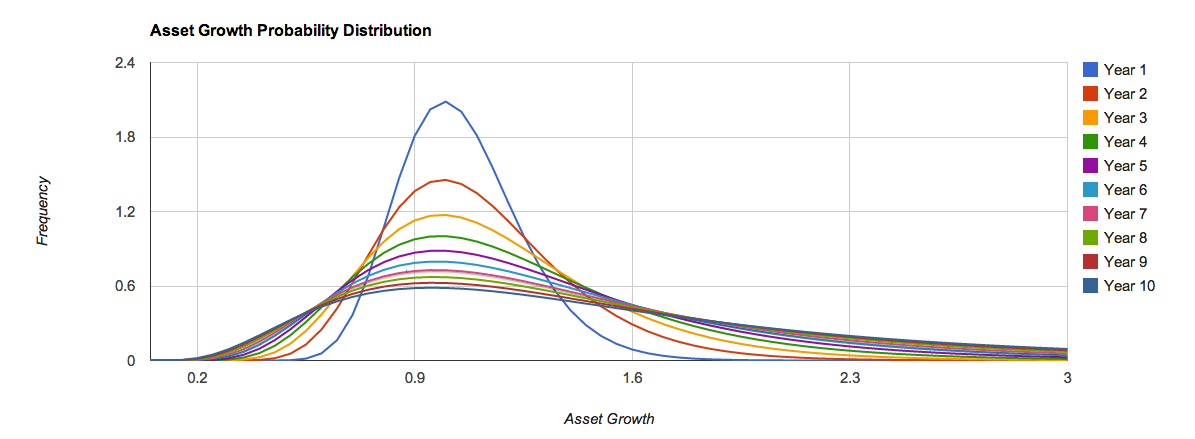
Likelihood of asset growth at return = 0.05, risk = 0.2

The simulation is available here

In fact, more disturbingly, the mode of asset growth (i.e. the most likely scenario) will be 100% on first year, 98% on fifth year and 95% on tenth year. I.e. the most likely scenario is that you lose money (this changes when the return/risk changes. For example, under return=0.05 and risk=0.1, the most likely scenario is that you gain).

My questions are:

a) Is this simulation a correct conclusion of Modern Portfolio Theory?
b) If it is correct, will using DCA change the behavior of asset growth? (To be more specific, will the most likely asset growth still be in the negative under a portfolio with e.g. return=0.05 and risk=0.2 when I use DCA?)

3
  • Is there any other way to get returns near to predicted by the compound interest formula with the risk you assume. Secondly ask Warren Buffet. Thirdly your simulation has assumptions, which can go either way. So it boils down to how correct your assumptions are.
    – DumbCoder
    Commented Oct 13, 2013 at 9:10
  • 2
    Those who are voting-to-close as "economics": Is it really? I see this as a question about investments & finance, not economics. Commented Oct 13, 2013 at 16:59
  • Asked about this on quant.stackexchange as well, and here is the answer quant.stackexchange.com/questions/9146/… (sorry for the cross post but I really wanted to know) Commented Oct 16, 2013 at 8:32

2 Answers 2

3

The question "do they?" is a fair one, but the answer, "we can only observe the past, and that's what they did," may not be so satisfying to you.

It's safe to say that any longer term view of any market will show far less volatility than a short one. It only takes a glance at the return of the 2000's

2009 27.11 2008 -37.22 2007 5.46 2006 15.74 2005 4.79
2004 10.82 2003 28.72 2002 -22.27 2001 -11.98 2000 -9.11

(for the S&P) to see that in an awful decade containing -37% and -22% that the full decade was "only" down 9% in total or just less than 1% per year compounded. I'm not predicting any particular returns forward, just noting this is how the math works.

DCA performs well through such a decade, better than in a rising one. You are offered the opportunity to buy into a market selling below the long term trend.

Added note in response to Enno's answer below -

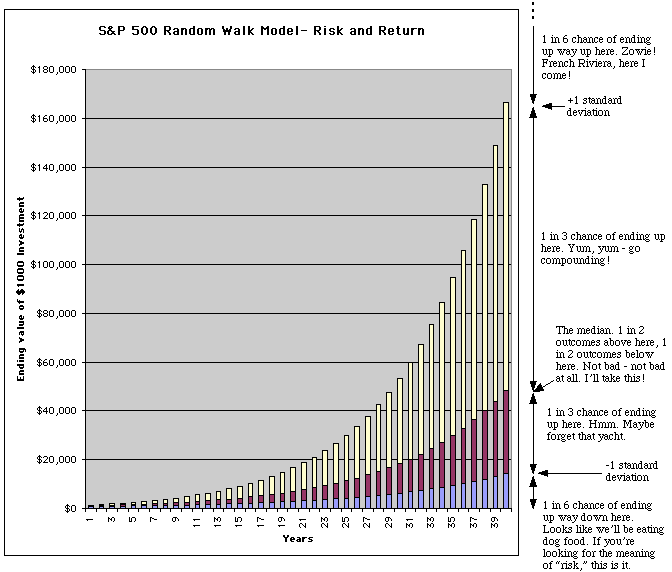
On rereading the linked article, I see where the author cites Zvi Bodie who clearly made a logical error. He concludes that since a 20 month S&P put costs triple what a 2.3 mo put costs, that there's more risk the market falls over the longer period, not less. American options can be sold or exercised at any time. If a 2 year option were cheaper than a 2 month option, no one would buy the shorter term. It's pretty simple that the Options Pricing Models take time into account and their value, put or call, increases along with the time till expiration.

On a lighter note, when I take the S&P data for 1871-2012 (I know, no S&P back then, but it's Schiller's data) I get average 40 year returns of 44X, similar to the author's conclusion, $1K growing to $44K. But, the Standard deviation is 28. So the high end of +1 STDEV is $72K, not the author's $166K. Although, the low end 44-28=16 comes close to his $14K figure. $16K is a 7.18% long term return which today doesn't look bad. When the article was written, the author was looking at a 6% short term risk free rate.

8
  • Thanks for the answer, as always. Did some research, and it seems that while it is true that the standard deviation of annualized return decreases overtime, because the asset value itself changes over time, the standard deviations of the total return actually increases over time. So it seems uncertainty about your portfolio's end value does actually increase the longer you hold the portfolio (see answer I added). Commented Oct 14, 2013 at 23:44
  • @EnnoShioji "So it seems uncertainty about your portfolio's end value does actually increase the longer you hold the portfolio" - this is what I call stating the obvious... The longer the time - the less ability to predict the future. Isn't it trivial?
    – littleadv
    Commented Oct 14, 2013 at 23:46
  • Wasn't trivial to me tbh even though after understanding it it makes sense. AFAIK, it's quite a popular belief that the longer you hold your portfolio the less uncertain you'd be of the end value because loss/gain will "cancel them out". Commented Oct 14, 2013 at 23:54
  • Thanks for the update. I'm guessing the price difference between you and the authors are coming from normal distribution vs log normal distribution? I think both calculation point to the conclusion that it's false to expect the return to converge to some value, while it shows you'd still have better deal compared to risk free rate. However, as I understand the most significant takeaway from authors' conclusion and the simulation is that you can essentially increase the probability to get a higher end outcome by taking lower risk, which I believe would come counter intuitive to many. Commented Oct 16, 2013 at 8:24
  • Or to be more precise I guess, "you can increase the most likely scenario's end outcome by taking lower risk" Commented Oct 16, 2013 at 8:28
-1

I researched quite a bit around this topic, and it seems that this is indeed false. Long ter asset growth does not converge to the compound interest rate of expected return. While it is true that standard deviations of annualized return decrease over time, because the asset value itself changes over time, the standard deviations of the total return actually increases.

Thus, it is wrong to say that you can take increased risk because you have a longer time horizon.

Source

enter image description here

2
  • Interesting article and chart. To be clear, the range is a low of 6.8% to a high of 13.5%. I don't see real results that have that range. 1910-1940 is a bit over 7%, no problem there. But the high end, 1970-2010 shows 9.9%. And yes, even that 3% over 40 years adds up. 9.9% over 40 years is $43.6K which makes the chart here far less insane. I see their point, over a very long timespan, the small STDEV will have a high impact. Commented Oct 15, 2013 at 0:11
  • I have issues with the author's premise as well as his math. Too long for comment, I updated my answer with my reasons for this. Commented Oct 15, 2013 at 22:24

You must log in to answer this question.

Not the answer you're looking for? Browse other questions tagged .