1

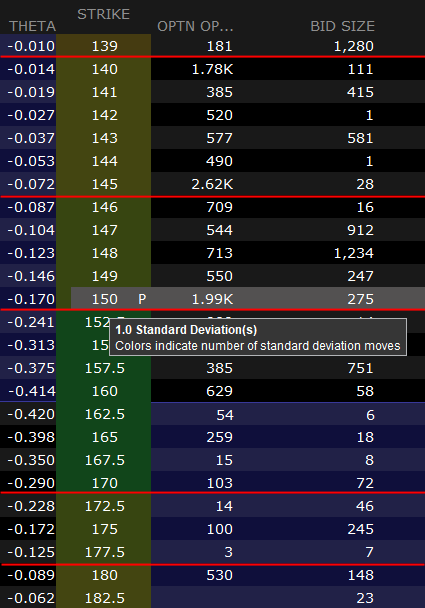
I originally posted this question to the coding section of StackOverflow, but did not receive any replies. I am wanting to calculate the min and max values for the various standard deviation "groups" similar to those as displayed in the Interactive Brokers Trader WorkStation (TWS) for option chains, i.e.:

TWS Option chain showing standard deviation groups

In the screen snapshot above the strike prices are grouped by color to indicate the number of standard deviation moves (I added the red lines to separate the color groups).

I would like to know how the min and max values in each group are calculated.

I was hoping someone could shed some light on how these numbers are calculated or provide a step-by-step formula or resource for doing so.

Update:

Thank-you @D Stanley.

The API I am using provides option Greeks for various tick types, for example, the following values were obtained from the API (different option chain from the one shown in screenshot above):

Stock last price: 33.01
Option Model underlying price: 32.86088562011719
Option Model Implied Volatility: 2.397441799226127

1SD = Option Model underlying price * Option Model IV * SQRT( days_to_expiration / trading_days_per_year )
    = 32.86088562011719 * 2.397441799226127 * SQRT( 4 / 256 );
    = 9.847757593157215

I can then calculate the min/max price range using the 1SD value, i.e:

price_min = Option Model underlying price - 1SD
          = 32.86088562011719 - 9.847757593157215

price_max = Option Model underlying price + 1SD
          = 32.86088562011719 + 9.847757593157215

I used a value of 256 from a reference book (Option Volatility & Pricing).

But I still have my doubts as to which Implied Volatility one uses as the API returns an IV value for various tick types, i.e.:

  • TickType.OPTION_IMPLIED_VOL - A prediction of how volatile an underlying will be in the future. The 30-day volatility is the at-market volatility estimated for a maturity thirty calendar days forward of the current trading day and is based on option prices from two consecutive expiration months.

  • TickType.LAST_OPTION -- Computed Greeks and implied volatility based on the underlying stock price and the option last traded price

  • TickType.ASK_OPTION -- Computed Greeks and implied volatility based on the underlying stock price and the option ask price ...

  • TickType.BID_OPTION -- Computed Greeks and implied volatility based on the underlying stock price and the option bid price ...

I was using TickType.OPTION_IMPLIED_VOL values, but I think I should be using TickType.LAST_OPTION values. Also, I am using the underlying (stock) price from the option data returned as well.

Thanks in advance.

1 Answer 1

1

They are most likely using "implied volatility" (not shown on your screenshot) which is defined as a 1-standard deviation annual move of the underlying price.

Meaning if an option has an implied volatility of 20% - it means that the underlying stock has a 68% chance (1 standard deviation assuming normal distribution of returns) that the stock will move within +/- 20% over the next year.

The expected 1-sd move of a stock over the remaining life of an option would be:

current_price * imp_vol * SQRT(N/365)

Where N is the number of days until the option expires (you can also use N/252 if you want to use weekdays until expiry)

The current price plus/minus that number would be the expected range over that period.

5
  • Thank-you @D Stanley, I updated my question to also include the calculation I am making using the data returned from the API. I am assuming the Implied Volatility (IV) is the IV of a specific OPTION contract - correct?
    – bdcoder
    Commented Nov 12 at 0:34
  • 1) using 256 is fine so long as your days to expiry is weekdays, not calendar days (252 is the average number of weekdays in a year; 256 seems like a math shortcut since SQRT(256) is 16. So it would slightly underestimate the 1sd move (but it's an estimate anyway). 2) There should be very little difference between the implied vols of the bid,ask,and last. Often the published "implied vol" uses a midpoint between bid and ask.
    – D Stanley
    Commented Nov 12 at 14:20
  • In this case it looks like they also publish an implied vol that's based on several option prices. Which is fine so long as the time periods line up (e.g. if they use a "30-day" vol you would want to use that to measure the 1sd move over the next 20 days. Shorter-period volatilities tend to be higher than longer volatilities.
    – D Stanley
    Commented Nov 12 at 14:25
  • All of those volatilities should be fairly close, and it's only a range estimate anyway, so there is no "right" answer.
    – D Stanley
    Commented Nov 12 at 14:39
  • @D Stanley - your correct again, regarding using 256 days, the book also mentions that 256 is favored because SQRT(256) is 16. I'll run more tests but am marking your reply as the "answer" as per your comments regarding it is an estimate anyway. But I think I have enough now to get a reasonably close estimate of ranges. Thanks again.
    – bdcoder
    Commented Nov 12 at 14:44

You must log in to answer this question.

Not the answer you're looking for? Browse other questions tagged .