1

This question is really about bond funds in general, but Vanguard funds are what I have experience with, so the details of my question and screenshots will be specific to them. But I hope this question will be useful generally as well.

I allocate a portion of my investments to Vanguard bond funds. One thing I have never been able to figure out as I look at their various offerings is how I can tell what the historical returns have been without taking into consideration changes to the share price. Let me explain what I mean by that and why I want to know this.

If you look at the Fund Info page for VBTLX - Vanguard Total Bond Market Index Fund Admiral Shares, you'll see that it shows a negative YTD return (as of today, -3.04%). If you look at the following image, you can see that other periods also show negative returns:

Vanguard VBTLX Historical Returns

I believe the reason for this is because in calculating these returns, they are considering not only the distributions of earned interest from the bonds but also changes to the fund's share price, which changed from a high of $11.77 in 2020 to the current price of $9.55. Therefore, if you had bought shares then, earned interest for four years, and then sold them today, you would have a loss. That all makes sense.

However, I don't really care about those numbers. The reason is that, in my investment strategy, once money goes into a bond fund, it doesn't come out. Money is either invested directly into the bond fund, or it graduates into a bond fund from a stock fund at regular intervals to maintain or achieve a target mix of stocks and bonds.

Therefore, since, under normal circumstances, I don't intend to sell shares of my bond fund, what really I want to know as I choose a bond fund is what I would have earned historically if I had invested a given amount in this fund. We know for certain that it would not have been zero! But I can't see anywhere that I can learn what it actually would have been.

It looks like the closest I can come is to look at the "Dividend income and capital gains" section of the page I linked above, where you can see monthly distribution yields going back 18 months.

So I guess my questions are:

  • Is there really no easy way to see what I want to see on a longer time scale?
  • Am I just the only person who wants to see this data?
  • If so, is that because I am missing some crucial piece of understanding about how all of this works?

Any insight would be greatly appreciated.


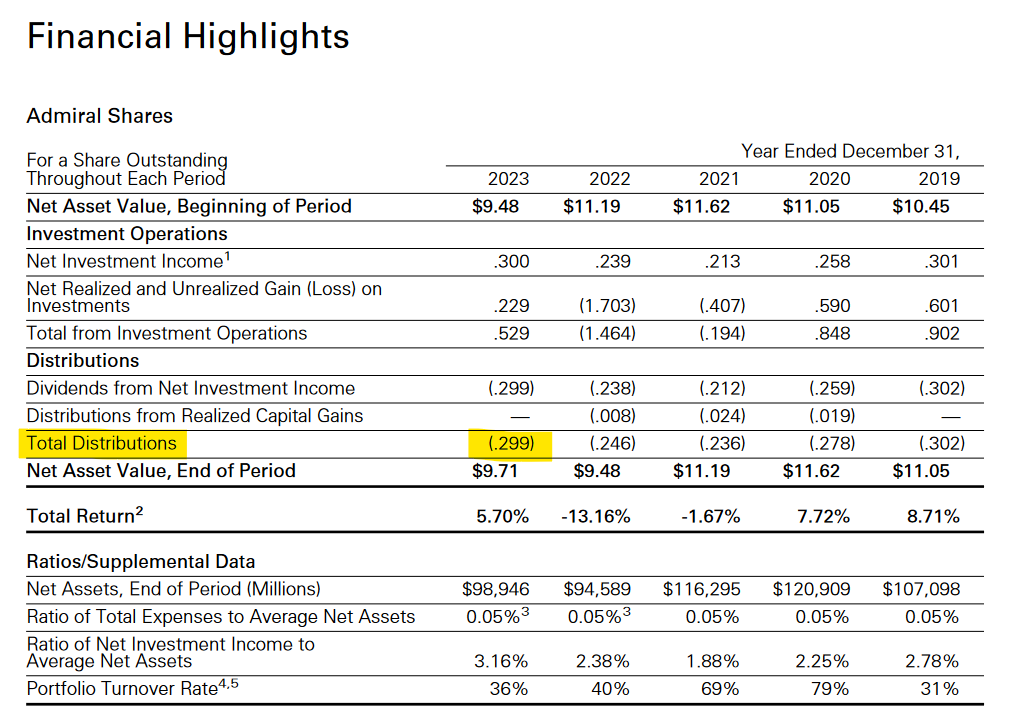
Edit: Thanks to @dave_thompson_085 answer, I think I see where to find this data. Here is a screenshot from the Annual Report for this fund, page 105.

enter image description here

If I am understanding correctly, the (.299) means 29.9 cents paid per share (regardless of the price originally paid for that share).

2
  • "what I would have earned historically if I had invested a given amount in this fund. We know for certain that it would not have been zero!" If you have no money coming out of the fund, then you are in fact earning nothing. Do you mean you only takes dividends and no capital distributions? Commented Apr 17 at 3:21
  • But there is money coming out of the fund. In every month of the last three years, where the chart above shows performance of -2.42%, dividends were in fact paid. So if I had money invested in that fund, I have would been receiving income every month. The chart shows -2.42% only because the share price declined. But if I'm not interested in selling my shares, but only in the monthly income that holding them gives me, that -2.42% figure doesn't mean anything to me. I want to know what my income is across time.
    – Brian Rak
    Commented Apr 17 at 19:32

2 Answers 2

1

If you go to "Fund Literature" at the bottom of the page, click on "View prospectus and reports", and download the Annual Report -- and it's convenient you chose Vanguard Total Bond, because I happen to hold some of it and therefore have already downloaded its reports every year since about 2010 -- then go the Financial Highlights page for your share class (Admiral is on PDF page 105), it shows the per-share income dividends, and cap gain distributions when applicable, for each of the last five fiscal years -- which for this fund happen to be calendar years also, but that won't be true for most others.

If you repeat this exercise every 5 years you could cut&paste the info together into a complete timeline.

1
  • Ah, okay, there it is. I've added a screenshot to my original question (since I couldn't do so here) where I highlight what I think is the line you are referring to. Could you take a look and confirm that this is the right line, and that my interpretation is correct?
    – Brian Rak
    Commented Apr 17 at 19:50
1

There are two components to a fund's total return - dividend return and price return. If you don't reinvest dividends, then you can just sum up the total amount of dividends you've received and divide by the initial purchase price for the net income return.

If you reinvest dividends, then you can just look at the "total return" value published by vanguard. For that fund, for example, the total return for that fund over the past 10 years has been 16.2% (total, not per year). It also breaks out the capital (price) return and income (dividend) return for each of the past 15 years. The income return has fluctuated between 1.8% and 4.37%, with the most recent year earning 3.28%.

As you can imagine, when you mix in different purchase dates it gets more complicated. But if you just want a general idea of the distributions of the fund over the past several years, that information is readily available.

3
  • Thank you for your reply. I think I see the 16.2% figure that you mention on the Vanguard page I linked, under Performance & Fees - Total Returns - Cumulative. Is this the one you mean? If so, it seems like this figure must still be taking into account changes to the share price, because the 3-year returns show -7.1%. This leads me to believe that the 16.2% figure, as well as their other quarterly after tax returns, cannot not the true dividend-only returns. Or am I misunderstanding something?
    – Brian Rak
    Commented Apr 16 at 14:33
  • 1
    No you are correct, the 16.2% is the total return, which is inclusive of price changes and dividends (and remember that when an ETF pays a dividend, the price drops by that amount). It should be_roughly_ the total price return plus the total dividend return, but not exactly since returns are not exactly additive.
    – D Stanley
    Commented Apr 16 at 14:55
  • Hmm. But in that case, it sounds like the answer to my original question is: There is no easy way to know the historical returns, ignoring changes in share price. In other words, if my question is "If I had invested $10,000 in this bond fund 10 years ago, how much interest would I have earned?" we know the answer is not $1620, because the 16.2% cumulative returns include the decline in share price. But what exactly is the answer?
    – Brian Rak
    Commented Apr 16 at 20:47

You must log in to answer this question.

Not the answer you're looking for? Browse other questions tagged .