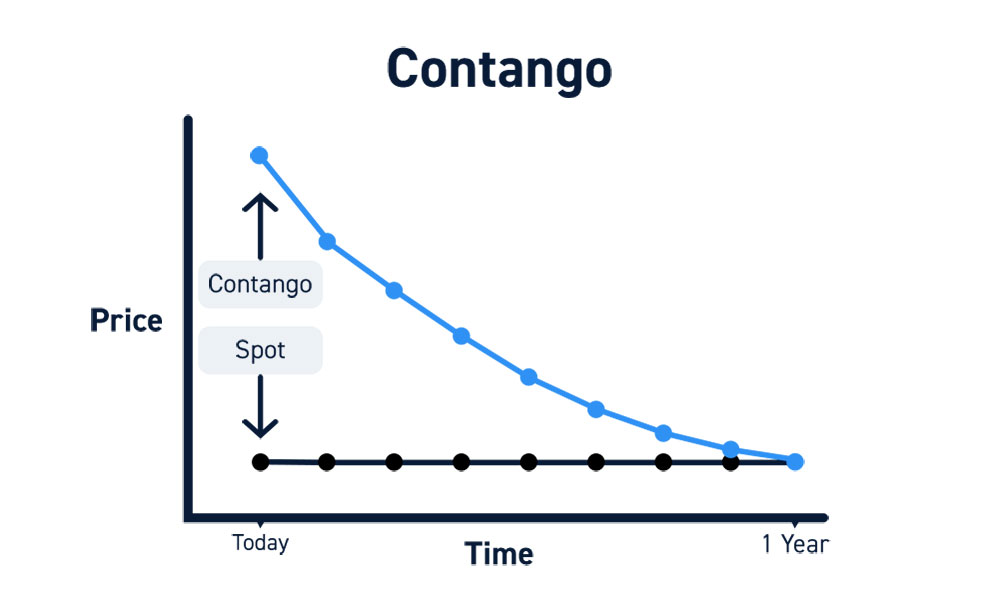
I found this image describing contango with the accompanying quote. I expected the graph be in the opposite direction that is price being lower today than in 1 year. Is this graph wrong?
is the pricing situation found with futures contracts where longer-dated futures consecutively trade at higher prices than the spot (current period) contracts. Usually, time premium and/or carry costs (for commodities) normally makes long-dated (further out) futures more expensive then near-term or current month futures.

