3

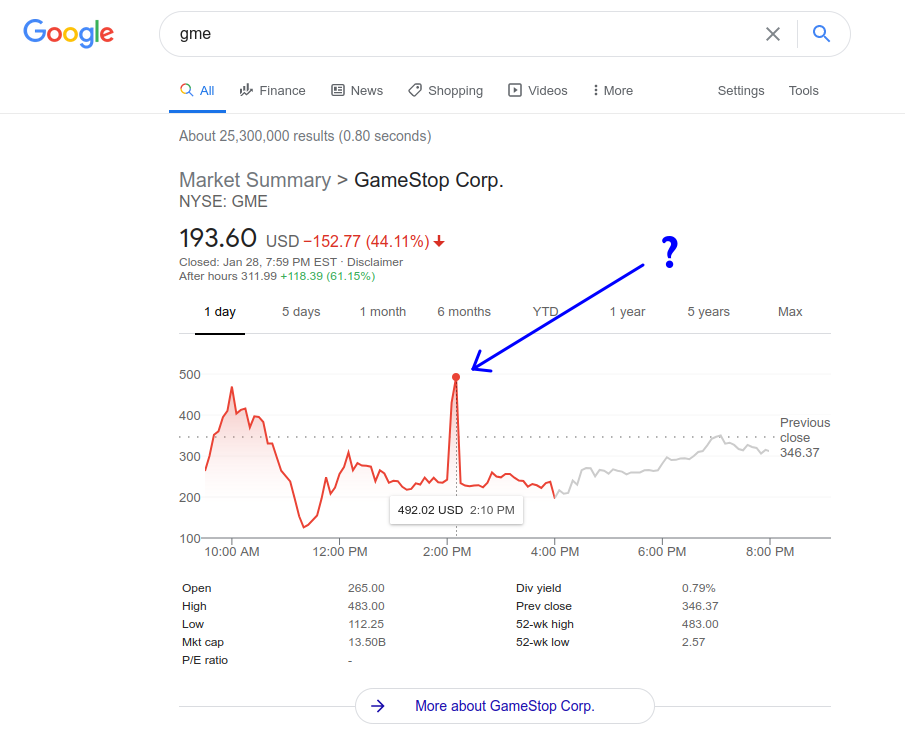
I've been reading about the GameStop situation, so naturally I googled the stock, and saw this:

GameStop blip at 2pm

The stock appears to have more than doubled at around 2pm, then went back to exactly where it was before after a few minutes (see the picture). What happened here?

I get that it is incredibly volatile at the moment, but even so this blip looks out of place.

0

2 Answers 2

3

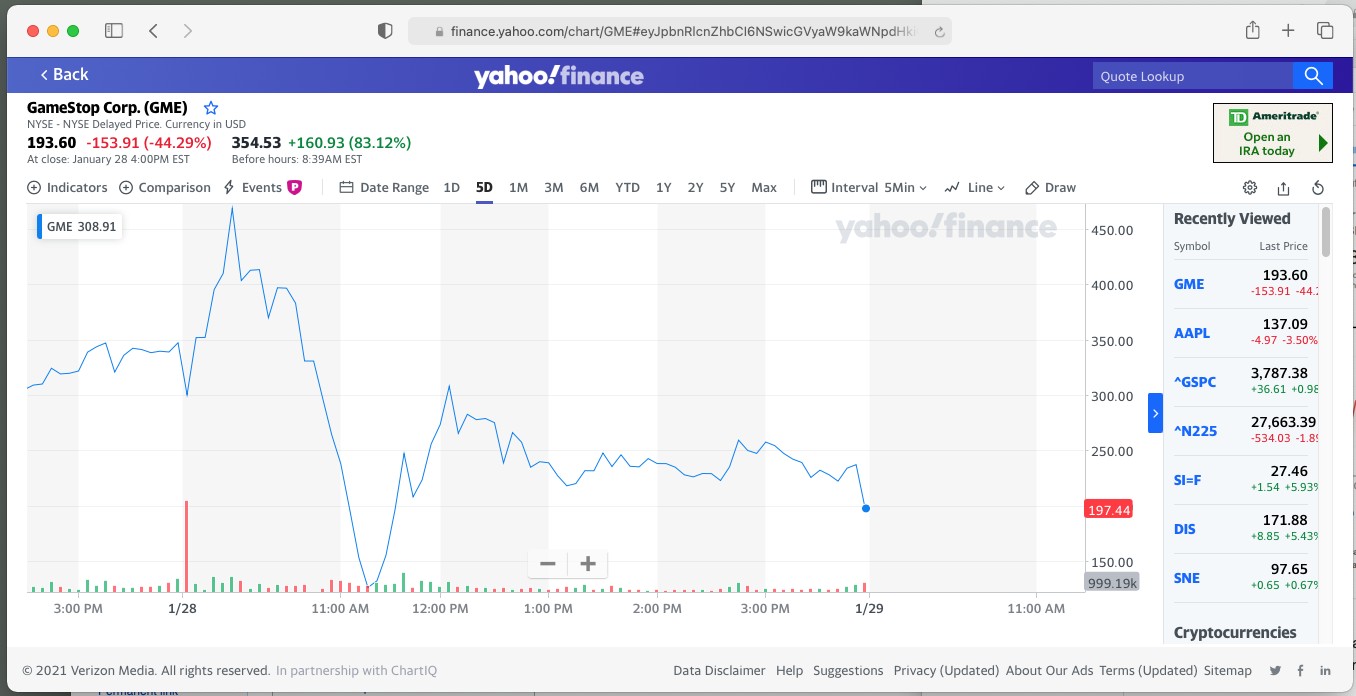
Simply go to yahoo finance, click full screen, and you can zoom in to see what's happening.

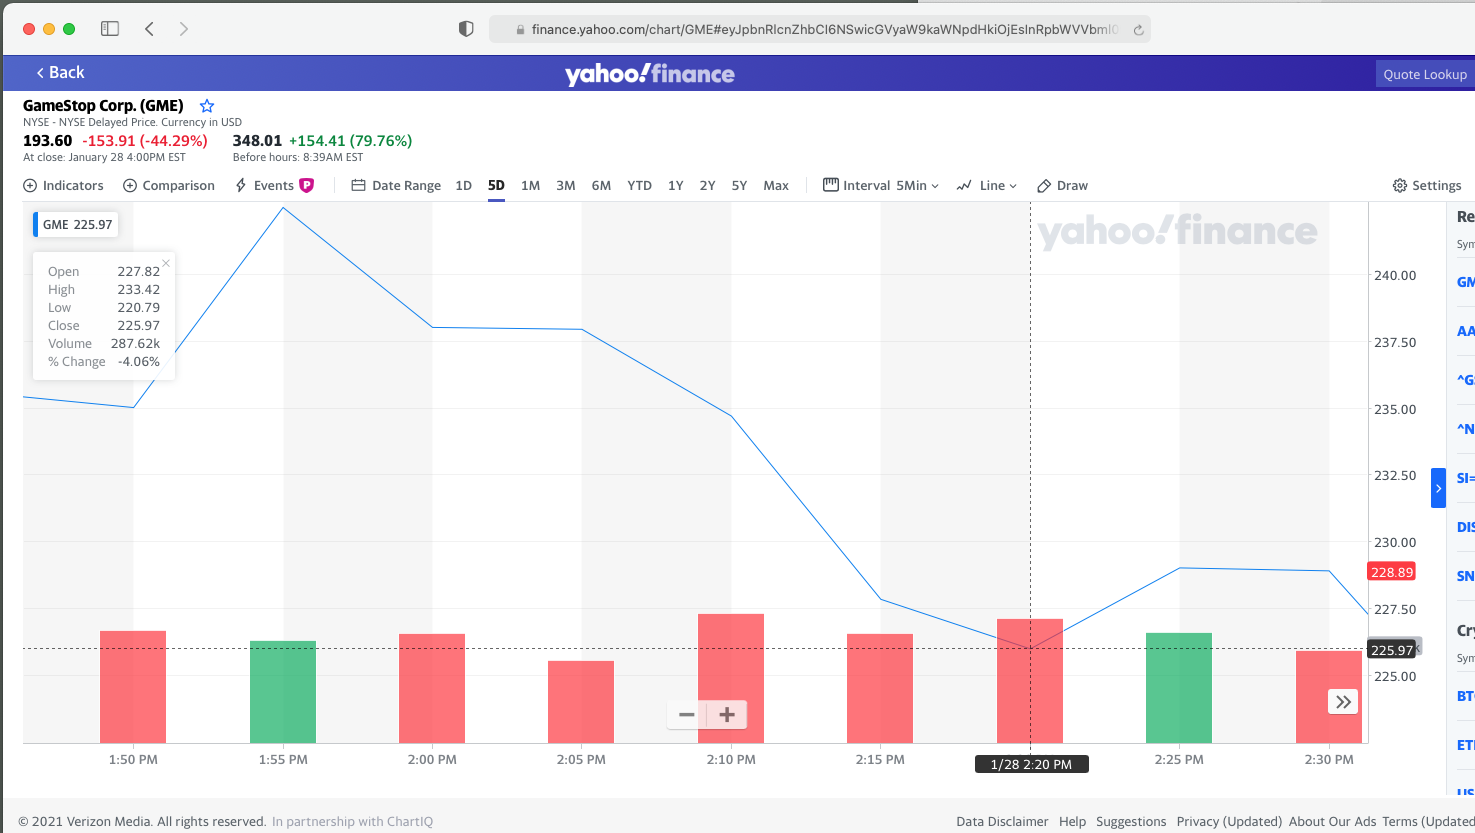
It (would appear) it was nothing more than bad data and is probably gone on that site you used already (it's Friday early now).

Again, just zoom zoom zoom to find out (you would have had to have zoomed at the time, since, if they have fixed/whatever the presumptive bad data, it would be gone now).

enter image description here

enter image description here

Simply finger your mouse up and down to zoom time.

0
2

Volatility happened. There wasn't necessarily news or any particular trader using new information to do this.

You will want to consider candlestick charts or OHLC charts for more granular data. In line charts like this each data point represents one order that occurred with the continuous line just being a linear path between the points, its actually skipping a lot of what happened. Both the Candlestick and OHLC charts show 5 pieces of metadata (open, high, low, close, and if the open was greater than the low or not). this also allows for better continuity between intervals that are polled.

2
  • CQ, I'm not sure if I understand your mention of sticks/OHLC - on most web site's web charts, the key is simply nothing more than to zoom in (regardless of which chart mode).
    – Fattie
    Commented Jan 29, 2021 at 13:43
  • @Fattie zooming in with a line chart and zooming in with candlesticks/OHLC enabled are still worlds apart in granularity.
    – CQM
    Commented Jan 29, 2021 at 19:37

You must log in to answer this question.

Not the answer you're looking for? Browse other questions tagged .