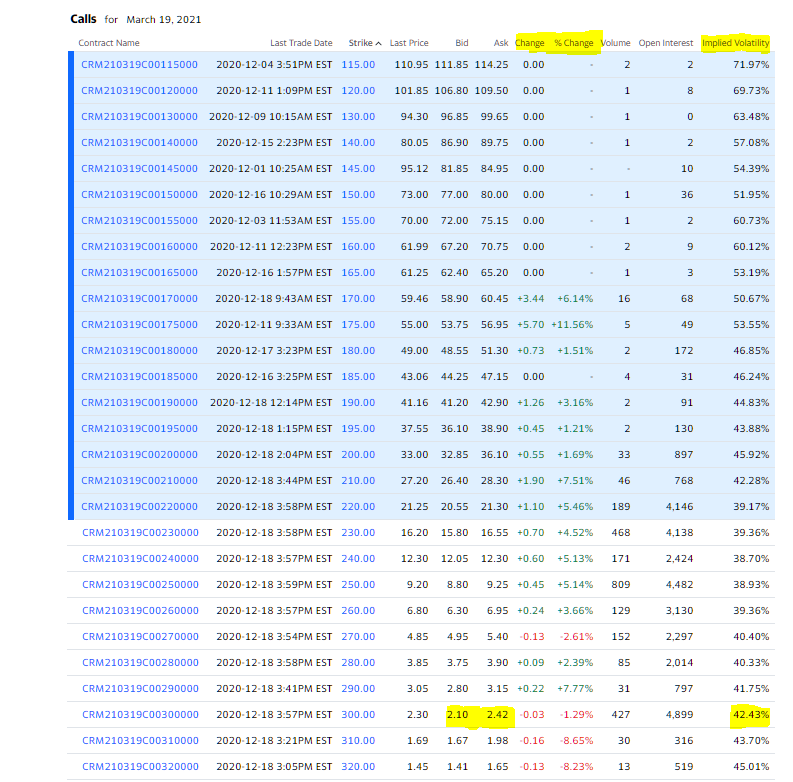
The following is the Options Chain of CRM (Salesforce) for March 19, 2021.
A few questions from the chart:
- What does the % Change mean in this chart?
- What does the Volume mean?
- At the $300 strike, I see 4899 Open Internet. Does that mean 4899 options have been sold by traders who are expecting the price to reach at $300?
- Is there any indication from the chart that the IV will not go down significantly for CRM before March 19, 2021 from the current level of 39%?
- What is the right option strategy for any stock symbol to play against the IV but only against the price?
- Take this scenario. A trader buy at strike at $115 at IV 71.95%. A month from now, IV drops to 25% but the price goes up to $240. Does that make a profit or a loss?
- From the Chart what is considered as a low IV? Is 40$ low IV?

