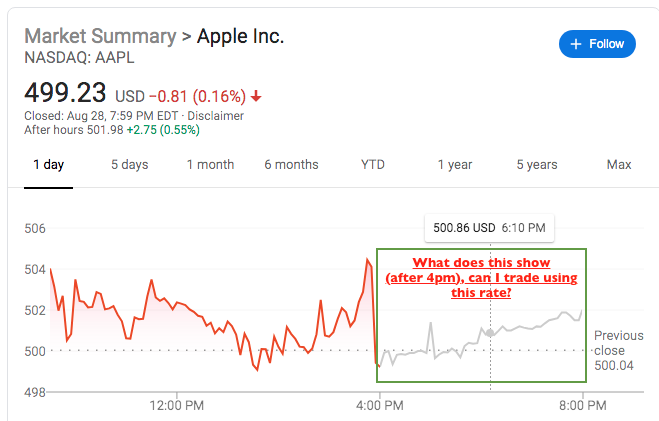
I new to trading and I would like to know why the graph of the stock after closing still follows a path up and down and why it is not a straight line.
Can I trade using on the weekend using the gray graph shown?
Is there any significance of this path/graph in the after hours? Does it affect anything or offer anything valuable that I can use to some advantage?

