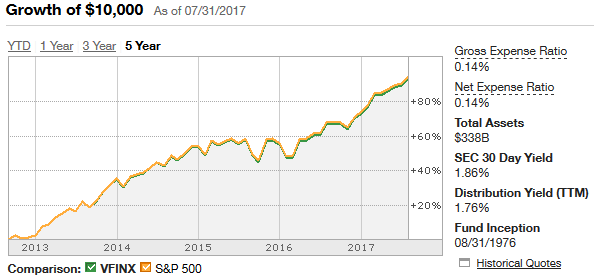
I'm new to investing, and have been trying to reconcile what various financial advisors recommend for long-term holdings. Some recommend sticking to passively managed index funds, claiming that few, if any, actively managed funds consistently track the market, let alone beat it; others recommend certain active funds precisely because they consistently outperform the market.
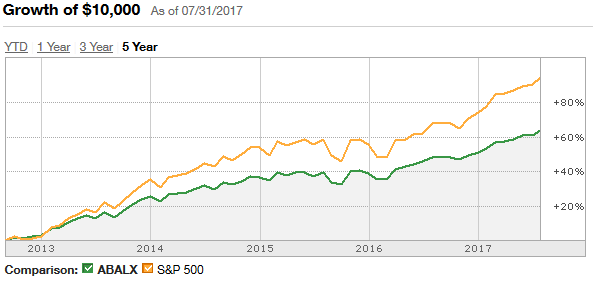
They can't both be right, so I fire up my trusty web browser and try to compare for myself. Unfortunately, I find the performance charts from various sources to conflict in the same way as the financial advisors. For example, consider 5-year performance of the ABALX mutual fund. On TD Ameritrade, I find the following performance chart, which (to my untrained eye) clearly shows ABALX lagging significantly behind S&P 500:
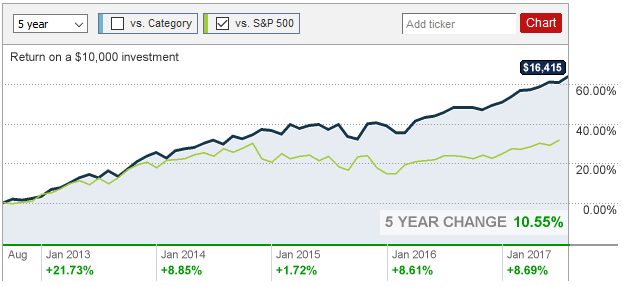
On the other hand, the same performance chart at CNN Money just as clearly shows ABALX significantly outperforming S&P 500:
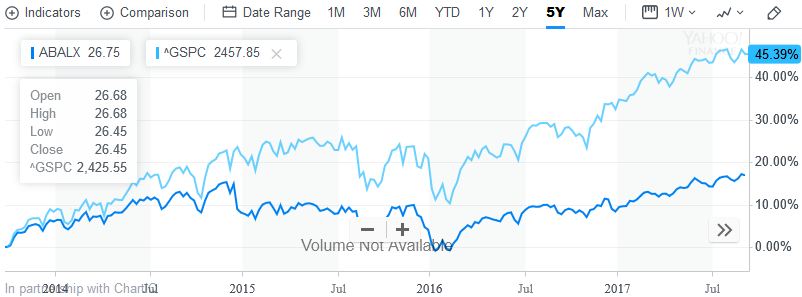
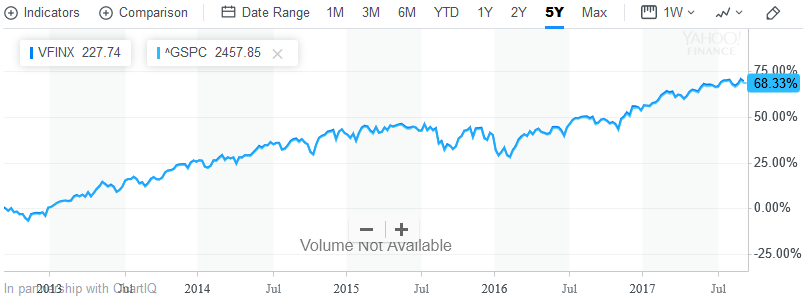
For additional confusion, Yahoo Finance conflicts with both of the previous charts:
TD and CNN agree on the performance of ABALX itself, but they disagree wildly on the performance of S&P 500... and Yahoo disagrees with both. I would have expected all these to be reliable sources, but something seems very wrong here.
Note: I chose TD, CNN, and Yahoo because they were the sites I could find that make it easy to generate charts; and ABALX because a financial advisor happened to mention it as a personal favorite. I've seen similar trends with almost every mutual fund and ETF I've looked at, though.
So my question: Which of these charts is correct? And in general, is there a better way to be comparing performance of a particular investment vs. "the market" that is less likely to lead to this sort of confusion?

