3

Since futures trade on a contract by contract basis, how can you plot the price over an extended period of time? As a reference I have included a plot of VX futures (VIX CBOE volatility index) from investing.com: enter image description here
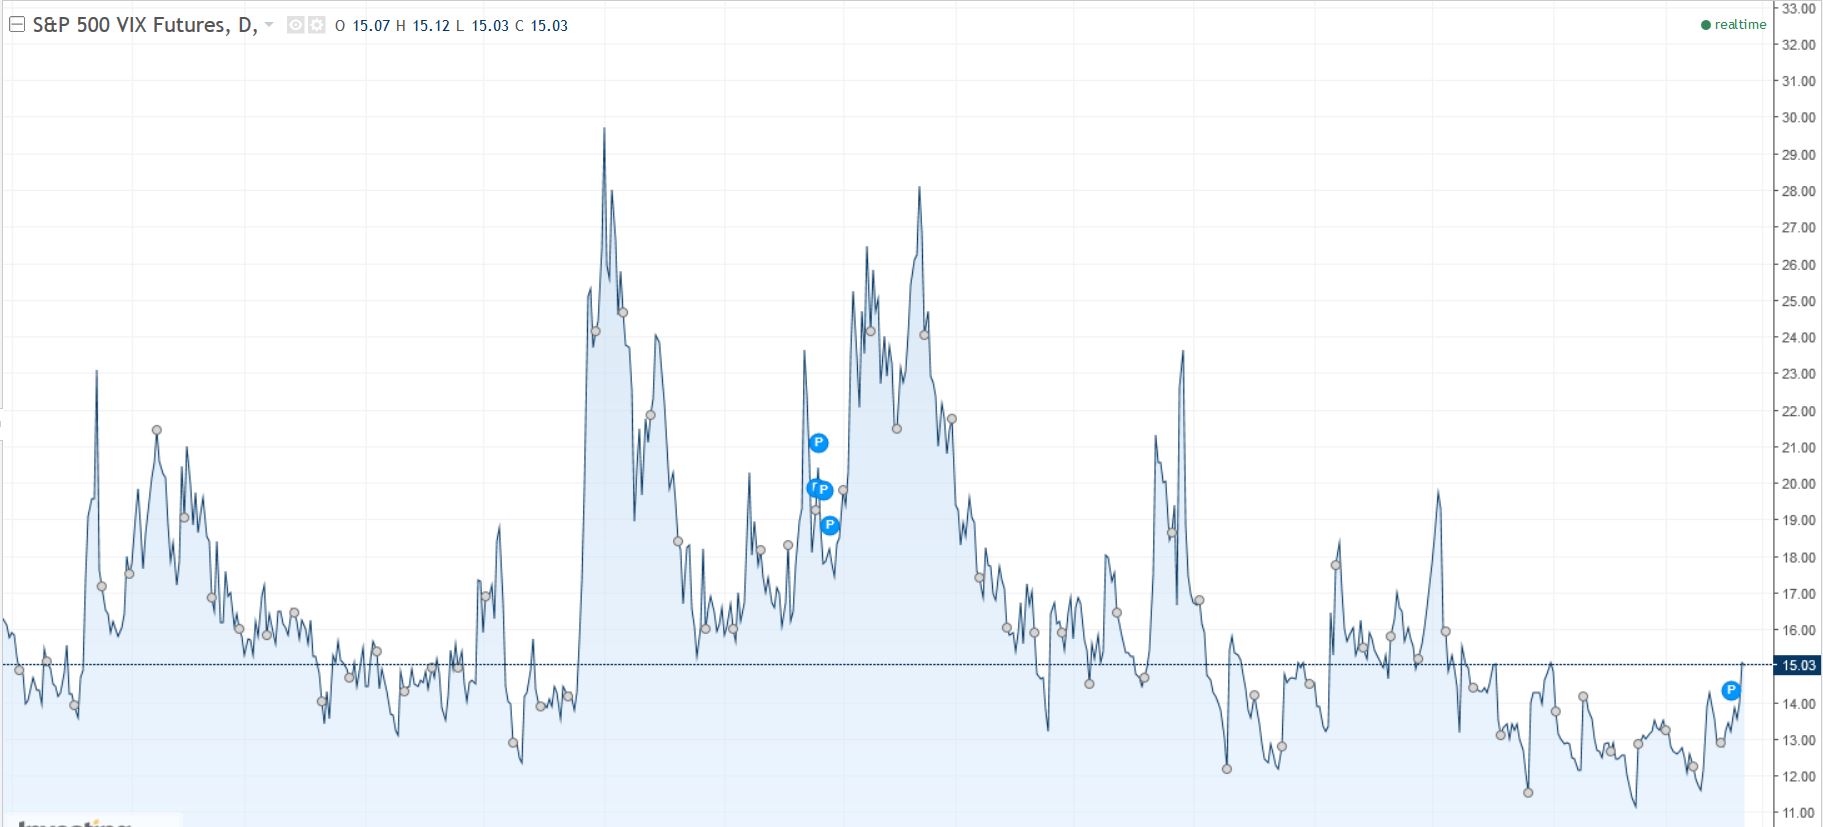
How do you determine when to roll from one contract to the other? Also is there not a price difference from the contract which is expiring and the one that is being rolled forward to? but yet there are no sudden price discontinuities in the charts.

Could anyone please explain what the method of extracting a continuous price series from a compilation of individual month by month contacts is?

2 Answers 2

2

Note that the series you are showing is the historical spot index (what you would pay to be long the index today), not the history of the futures quotes. It's like looking at the current price of a stock or commodity (like oil) versus the futures price. The prompt futures quote will be different that the spot quote. If you graphed the history of the prompt future you might notice the discontinuity more.

How do you determine when to roll from one contract to the other?

Many data providers will give you a time series for the "prompt" contract history, which will automatically roll to the next expiring contract for you. Some even provide 2nd prompt, etc. time series. If that is not available, you'd have to query multiple futures contracts and interleave them based on the expiry rules, which should be publicly available.

Also is there not a price difference from the contract which is expiring and the one that is being rolled forward to?

Yes, since the time to delivery is extended by ~30 days when you roll to the next contract.

but yet there are no sudden price discontinuities in the charts.

Well, there are, but it could be indistinguishable from the normal volatility of the time series.

1

This is actually a topic of some considerable research. The answer by D stanley is good, and I would add that the usual approach is to create a synthetic time series in stages by:

  1. creating an algorithm that computes a series of contract expiries and 'roll' dates (dates upon which you would sell the shorter expiry future and buy a longer expiry future) using the expiry schedule, a mask for illiquid months, contract dates of either first notice date or last trade date and a date offset.
  2. using the contracts and roll dates to create a 'raw' stitched time series of the actual market prices of the contracts required
  3. create a series of adjustment factors on the roll dates by either subtracting the longer expiry prices from the shorter, or a ratio
  4. Applying these adjustment factors to the raw stitched series to create an adjusted series.

This adjusted series will have no price discontinuities. It also follows that this series can be negative at times.

The process needs to be computed for each point in the forward curve (4th Eurodollar contract vs 2nd), and each series (Eurodollars vs WTI). Each adjusted series computation will require a different configuration to achieve something that is consistent and usable.

Some providers like bloomberg pre-compute adjusted series for contracts for the casual user. For example the ticker 'ED4 comdty' will give an adjusted series for the 4th quarterly eurodollars contract traded on the CME.

You must log in to answer this question.

Not the answer you're looking for? Browse other questions tagged .