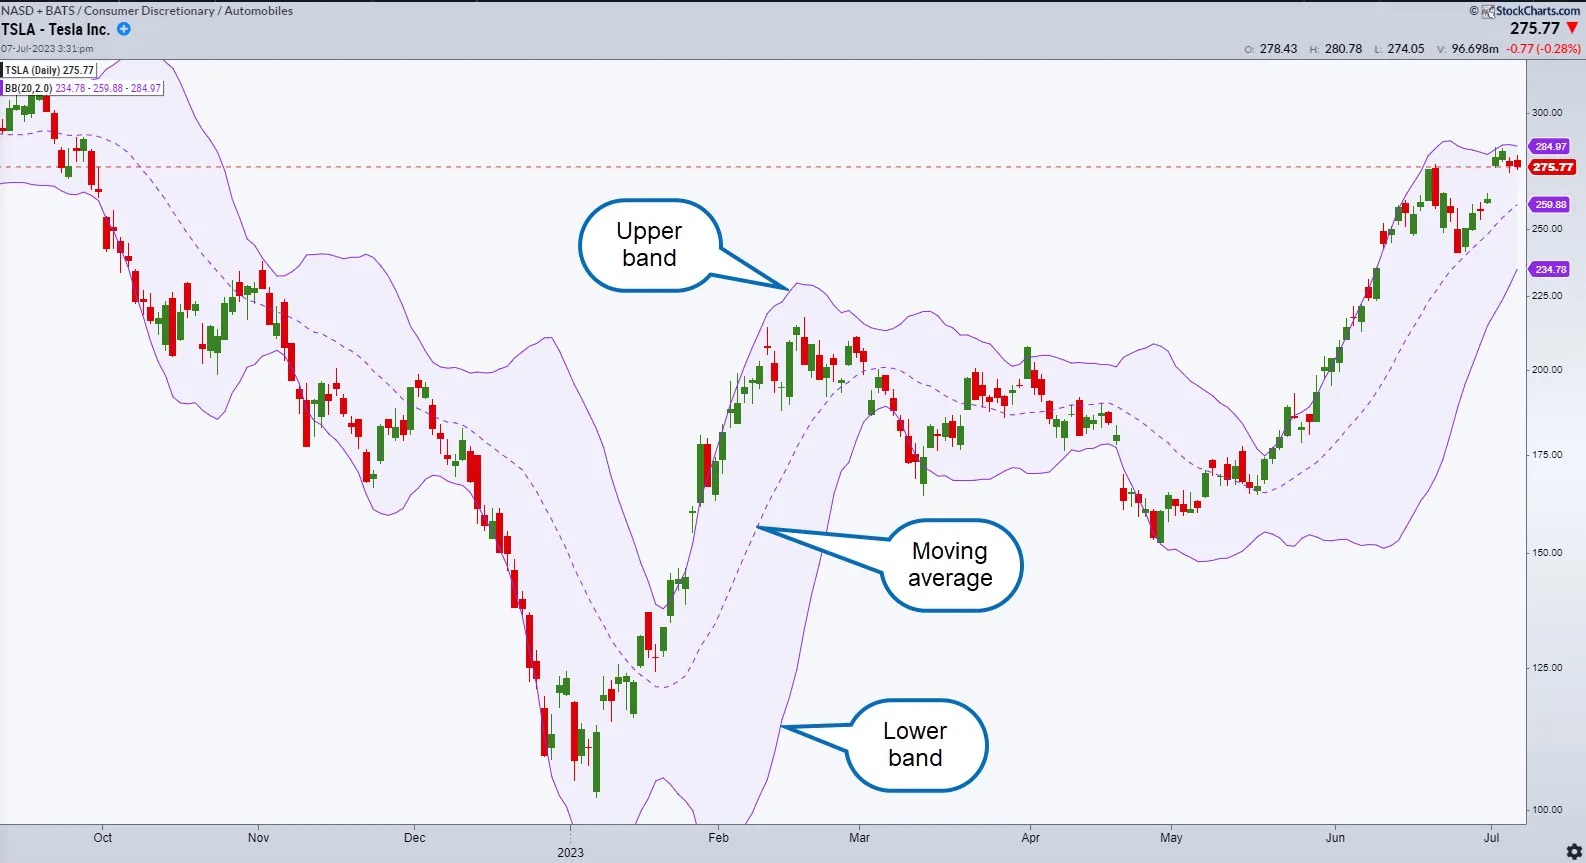
I'm studying some indicators and I'm struggling with how these tools plot the bollinger bands upper and lower bands. Every source that I've found says the bollinger bands are calculated as follows:
Upper band = 20-day SMA + (20-day SD x 2)
Middle band = 20-day SMA
Lower band = 20-day SMA – (20-day SD x 2)

where SMA = simple moving aveage and SD = standard deviation
However this will give a single value, how do I plot a line with a single value? shouldn't this give one value for each candle? For example, if I have the following candles:
(close=193.7035 high=193.7035 low=193.4775 open=193.5383)
(close=193.7383 high=193.8503 low=193.7081 open=193.7094)
(close=193.6955 high=193.749 low=193.5667 open=193.7433)
(close=193.7578 high=193.7578 low=193.6364 open=193.6689)
Then:
SMA = 193.7237
SD = 0.0253
upper bands = 193.7745
lower bands = 193.6729
from here, how could I plot the bollinger band lines with just a point? (assuming that for the point, X would be the candle index and Y would be the upper/lower bands values, so I'd have (0, 193.7745).
How to plot this into a chart like this:

From what I understand I'd need to calculate one value to each cande... I understand this might be a stupid question, but I just can't find an answer...
