1

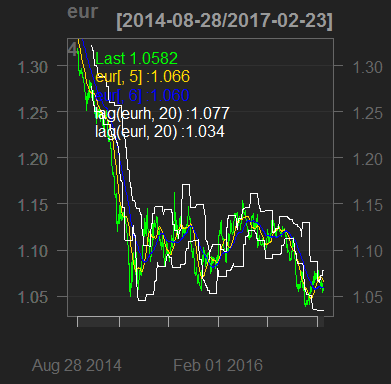
In my data I'm looking at 20 day highs and lows of a security. Hence the upper channel is the 20 day high and lower channel is the 20 day low. This is my graph of the 20day high/low (white band) and last prices (green band):

enter image description here

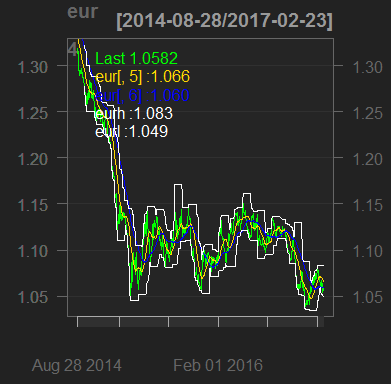
It seems that prices never break out of the price channel . I then decided to lag the price channel by 20 days:

enter image description here

Is this the correct way to go about looking at price channel breakouts? I'm trying to have something run in R to recognize when a breakout occurs. Consequently, I need a concrete arithmetic expression for when breakout occurs. However, this is really difficult in the first graph because the prices barely touch the channels.

4
  • @Grade'Eh'Bacon - this question is about technical analysis and not quants, so it does totally belong here.
    – Victor
    Commented Mar 28, 2017 at 19:53
  • @Grade'Eh'Bacon - from the quant site: "The Quantitative Finance Stack Exchange is intended for professionals and academics involved in quant modelling or trading. Good questions are focused on an actual problem you face in the course of your work as a quant or academic researcher. If you have a question about: •securities valuation •risk modelling •market microstructure •portfolio management •financial engineering •econometrics then you're in the right place to ask your question." Nothing about TA.
    – Victor
    Commented Mar 28, 2017 at 21:24
  • @Grade'Eh'Bacon Thanks for the reply. As mentioned in another comment, I've asked a TA question on quant before and I've gotten that question closed immediately. Also, apologies for not making this clear but my first plot is actually a plot of last prices against the highest (and lowest) observed prices in the last 20 days, thus creating a 20 day price channel. So I'm comparing x day's prices to the highest/lowest price achieved in the last 20 days from x. It's not a plot of prices and the respective highs and lows observed on that day.
    – Nikitau
    Commented Mar 29, 2017 at 0:41
  • @Nikitau TA+FT=not good. FT is very hard for beginners I would suggest you to try some stocks first.
    – sanaris
    Commented Jun 5, 2017 at 19:48

1 Answer 1

1

The chart is updated for every high/low, so there can never be high/low of price above the 20 day high/low.

Working pseudocode would look like this:

if current day high > high of 20 periods at previous day

Alternatively you can offset the chart by 1 so the high/low touch the price.

You must log in to answer this question.

Not the answer you're looking for? Browse other questions tagged .