-1

First time writing a question here!

I'm creating a simple bot to trade with stock. It uses indicators such as Moving Averages or Bollinger bands to evaluate the price of the stock and decide whether to buy, hold or sell depending on the values of these indicators. This evaluation is made periodically (every 4 hours let's say).

When it's time for the bot to evaluate the position, he requests the value of the stock at that precise moment (current value) and adds this value to the indicator.

Until here everything is alright. However, I am wondering what is more representative to correctly compute the indicator. For the past values, should I use :

  1. The current values that I used in previous periods
  2. The mean values from past candlesticks

I hope I'm clear enough.

Thanks for your advice!

UPDATE

I feel i didn't explain myself well enough. at every period, the bot checks the current price of the stock (1. in question above and yellow circle in the graph). enter image description here
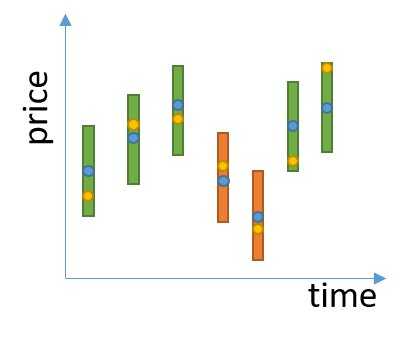
On the other hand, there are the candlesticks (in green and orange) which have their mean value (2. in question above and blue circle in the graph).

I'm not sure whether to use the means of the candlesticks (in blue) to create the indicators or the current value (in yellow).

I hope I made myself clearer.

6
  • 1
    In theory, you find an edge and then you quantify it in numerical terms (an algorithm) that can be utilized in real time. From your update, it now sounds like you are asking us what content would be best used in making your indicator more effective. How should we know? The way to determine what has BEEN effective is to back test the algorithm against historical data. That will provide performance results. I can assure you that any indicator based on moving averages with have numerous performance issues due to lag versus whipsaws (long vs short moving averages). Commented Apr 8, 2019 at 15:31
  • Thanks. so indeed is just about performances, not about representativity of the indicator.
    – Alvaro
    Commented Apr 8, 2019 at 15:36
  • YW. I don't know what "representativity of the indicator" means. What other reason is there for an technical indicator other than performance? I think you covered that in your second sentence: "I'm creating a simple bot to trade with stock." Find the edge and you have something... but hordes of people have already tried this and there's some pretty sophisticated trading software out there. You may just be attempting to reinvent the wheel. Commented Apr 8, 2019 at 15:43
  • 1
    An indicator is anything that you want it to be. I can't tell you what is currently available since it has been decades since I went through my 'indicator phase'. See if you can find any free web sites that offer the ability to back test various technical indicators. If advancing your programming skills is your objective, see if you can code the web site's indicators, duplicating their results (hoping that they coded it right :-). Good luck! Commented Apr 8, 2019 at 16:24
  • 1
    If you're going to play around with moving averages, take a look at the Hull Moving Average. It provides smoothing AND reduces lag and they are the opposing forces in traditional moving averages. Nothing is perfect but AFAIC, the HMA is an improvement. Commented Apr 8, 2019 at 20:50

1 Answer 1

0

The are 3 types of moving averages: Simple, Exponential and Weighted. Exponential and Weighted moving averages give more weight to recent data and since they are kissing cousins, you rarely see mention or usage of a Weighted Moving Average.

A moving average is calculated from the values for a specified period. The period can be anything that you want: Five minutes, 1 hour, one day, or in your example, every 4 hours.

In the case of a 10 period Simple Moving Average, for every new reading used, the oldest reading is dropped and the most recent 10 periods are added up and divided by 10. In your example, this would be the most recent ten 4 hour readings.

An Exponential Moving Average is far easier to calculate and maintain since it only requires knowing the previous EMA and proportionately adjusting adjusting it by the new reading.

A Bollinger Band is a bit more of a complex calculation but at its core is an "X" period Simple Moving Average, generally 20 days.

These are all standard calculations and you can find the formula details with a Google search.

3
  • Thanks for the answer. I think I haven't explained my question well enough. I'll update my question so be clearer
    – Alvaro
    Commented Apr 8, 2019 at 13:22
  • Isn't Exponential a subset of Weighted? Commented Apr 8, 2019 at 20:18
  • For decades, they''ve listed the most common moving averages as Simple, Exponential and Weighted. There are other types as well, more so in recent years. As I mentioned, Exponential and Weighted MAs are kissing cousins because they're just different weightings. The elegance of an EMA is its simple construction. Weighting is more cumbersome and requires more data. If you want to consider Exponential MAs a subset of Weighted MAs, I wouldn't argue the point. If I were to, I'd consider the reverse because an EMA "weights" more recent data more heavily. Six of one, 1/2 a dozen of the other. Commented Apr 8, 2019 at 20:45

You must log in to answer this question.

Not the answer you're looking for? Browse other questions tagged .