Firstly, you mean resistance not support, as a support is below the current price and resistance is above the price. Secondly using a MA as support or resistance would mean that that support or resistance level would move up or down as the price moved up or down and would not be static at $25.
Generally stocks will range trade more often than they will be trending (either up or down), so a stock can be range trading between a support and resistance levels for months and even years, and usually the longer it range trades for, the bigger the outbreak (either up or down) will be when it does happen.
Using a MA (especially shorter dated ones) as support or resistance (or as a up or down trend line) works better when a stock is already trending up or down. When a stock is moving sideways it will tend to keep crossing above and below the MA, and you will be whipsawed if you try to use them as your trigger for entry in these situations.
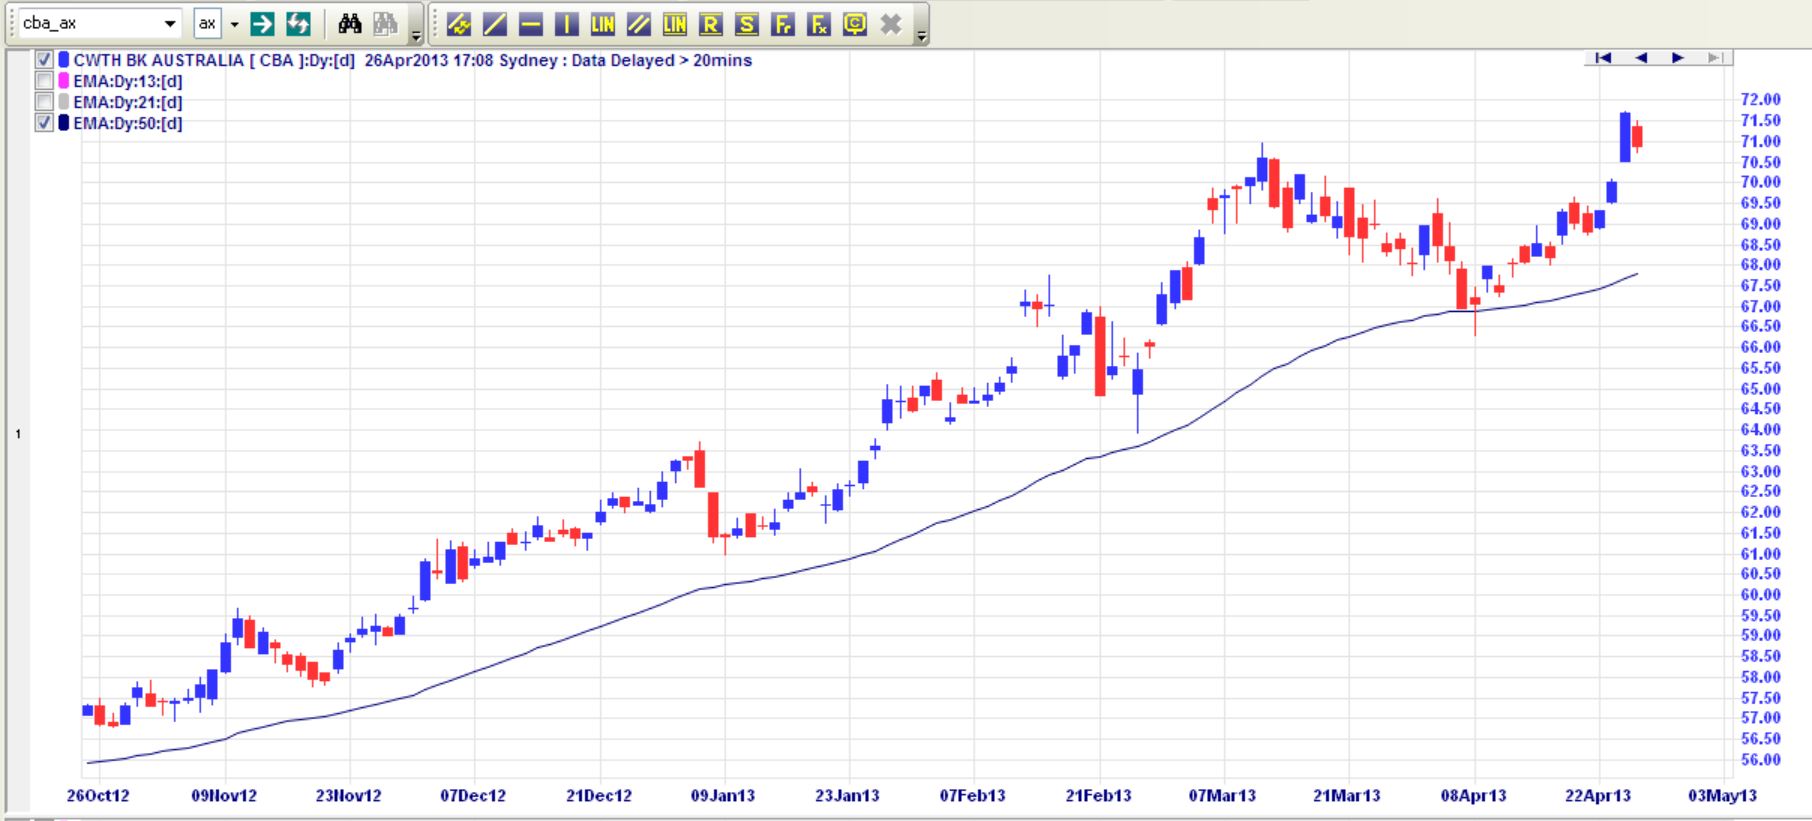
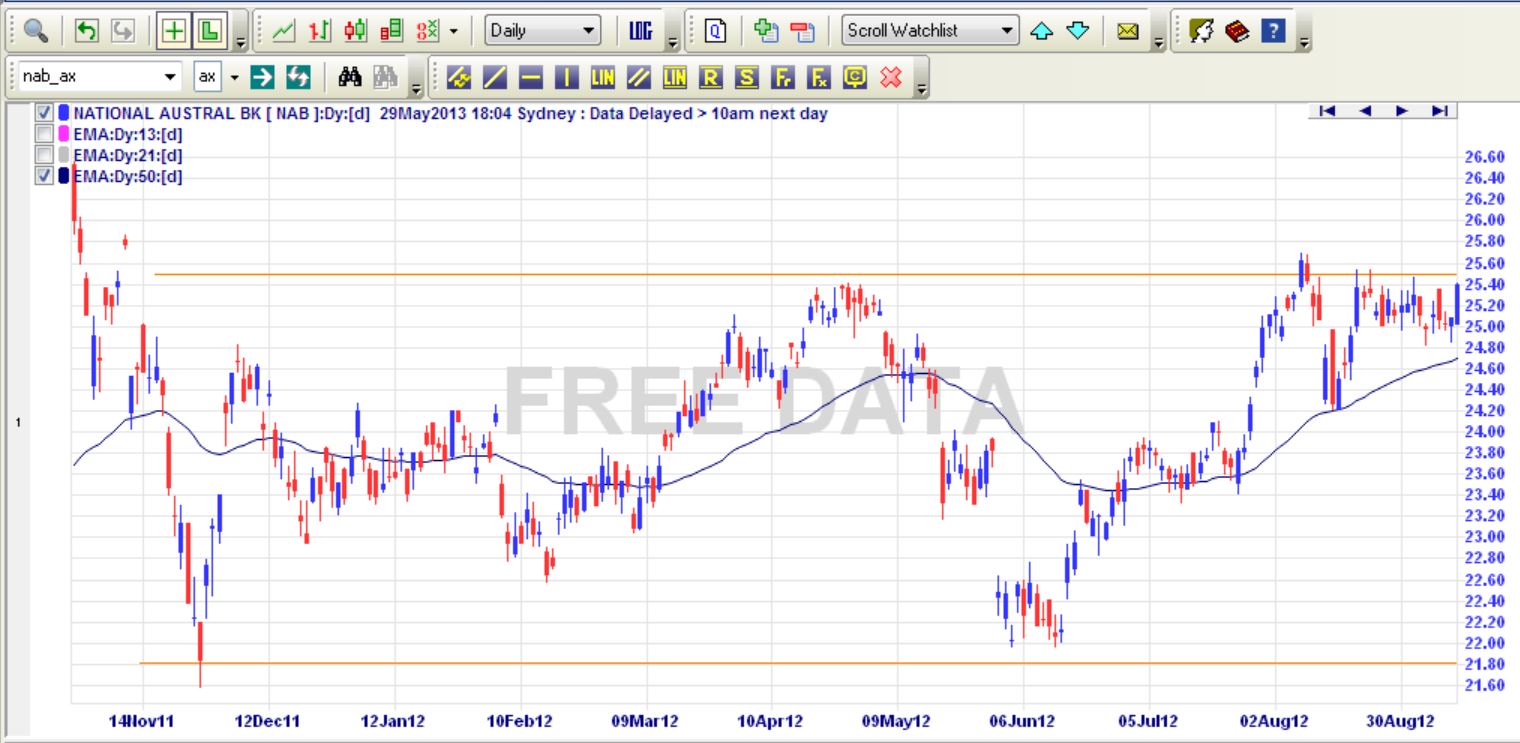
Compare the two charts below:

In the first chart the stock is up-trending for over 6 months and the 50d EMA is being used as a support or up-trending line. As long as the price does not break through and close under the 50d EMA then the uptrend continues. You could use this EMA line as a means of entering the stock when prices move towards the EMA and bounce off it back up again. Or you could use it as your stop loss level, so if price closes below the EMA line you would sell your position.

In the second chart, the stock has been range trading between the support line at about $21.80 and the resistance line at about $25.50 for 10 months. In this case the price has been moving above and below the 50d EMA during these 10 months and you may have been whipsawed many times if you were trading each break above or below the 50d EMA. A better strategy here would be to buy the stock as it approached the support line and bounces up off it and then close and reverse your position (go short) when the price approached the resistance line and bounces down off it.
Edit: When range trading you would have your stops just below the support line when going long and just above the resistance line when going short, that way if it does break through support or resistance and starts trending you will be covered.
So this shows that different strategies should be used when a stock is trending to when it is range trading. MAs are better used as entry signal during an established uptrend or downtrend than when a stock is range trading.


