Yes. The problem with this type of crediting has to do with the volatility of the S&P from month to month. Even in a year where the S&P is up a tremendous amount, say 20%, there will be months that had a large gain, maybe four or 5%. Those gains are capped but then the losses will cancel out much of the gains and the result will be very disappointing.
It's not very difficult to go to a source of data, like Yahoo or Google, and pull down monthly numbers for the S&P 500. You can then apply this formula within a spreadsheet to see the impact, I will return tonight or tomorrow and update with the results. I have received this question in real life and number of times and my response has always been, "have you asked the salesman for an example of how this would've performed during any time?" Of course the answer was no. Why would that be? He'd have the opportunity to show the result in good year vs bad. "you lose nothing in these crash years." But (as I edited below) you gain so little in the up years, the product should be viewed as a scam. Only it's legal.
You give up so much of the upside over the years in exchange for not losing any money in one year that you would literally have been better off in short term treasuries.
This is one of the few products that's actually worse than a variable annuity or a whole life insurance policy.
Last, because these products are sold by an insurance salesman and not as a regular product like stocks or bonds, the regulation is different. It is difficult if not impossible to find the prospectus for these online. And when I've gone head to head with somebody online, they told me it was illegal for them to send me a prospectus as they were in a different state. How absurd is that?
Edit -
I would like to add just 2 years' observations.
The index was up 23.5%. (more with dividends, I'll ignore that) The return on an IA, given the 2% monthly cap formula, was 0%. Yes, 0. The multiple months of 5%+ were capped, but the 2 months of dropping were included. Imagine, owning an "investment" that should return some fraction of the S&P, up 23%, and you get zero.
Index return? 30%. IU return 14%. Not as bad as 2009, but less than half the S&P return.
A more exhaustive analysis would show that treasuries would beat this ridiculous product.
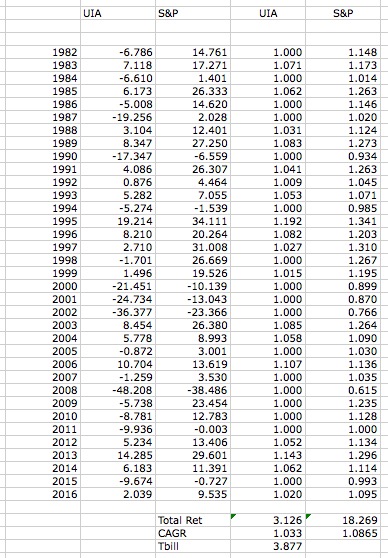
This is the snapshot of 35 years of the strategy the FIA offers:

First col, the sum of monthly returns per the crediting rules of the FIA, monthly gain capped at 2%, losses not capped. But, transferring to col 3, the return ignores down years. The S&P return ignores dividends. Trading the dividends for downside protection might make sense, but as you can see, the FIA return lags even that by over 5%. The S&P including dividends returned 11.54% over this time.
For those who are risk averse, and suggest that my math ignores this, that the client would be in cash, I looked up 3 month T-Bills. You can't get much cashier than that. The T-bill return over this period was 23% higher (the cash you'd get), 3.877% vs 3.162% for the FIA.
When I sat with a person to review this, years ago, the salesman refused the appointment. He told her that she saw his presentation, and needed to make a decision. In the notes she had from their meeting she wrote "annual return as high as 24%. Never less than 0." 50+ page prospectus, but no real historical sample returns. All calculations showed with awful years with the FIA protecting the client, or positive years where the returns were statistically improbable, and the return capturing 70-80% of the S&P return.
As I note in a comment. I'd be happy to see if these products have changed. From what OP described, it's exactly as I recall, and just as awful.

