I found a page on Vanguard's website, Vanguard portfolio allocation models, that provides historical returns based on different portfolio makeups, but I don't know whether they are providing geometric averages (considering compounding, also called the compound annual growth rate), i.e., reinvesting stock dividends by using them to buy additional shares, and compounding available with certain types of bonds.
1 Answer
From the Vanguard page -
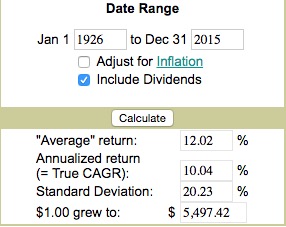
This seemed the easiest one as S&P data is simple to find. I use MoneyChimp to get -
which confirms that Vanguard's page is offering CAGR, not arithmetic Average. Note: Vanguard states "For U.S. stock market returns, we use the Standard & Poor's 90 from 1926 through March 3, 1957," while the Chimp uses data from Nobel Prize winner, Robert Shiller's site.
-
Awesome thank you! By the way I found that MoneyChimp calculator very useful (from your answer to a previous question I had), thanks for sharing that as well.– nCardotCommented Mar 30, 2017 at 19:58


