Is there an indicator that shows price growth for a particular market item (stock, commodity, forex) per timeframe? I mean like price growth/decline in last 24 hours or other time period?
-
It's easy to find closing prices for stocks or indexes, then divide current by the date a day/week/month ago. Is this what you're looking for or one thing more complex?– JTP - Apologise to Monica ♦Commented Nov 8, 2013 at 8:17
-
Yes, it is that easy, but I thought there would be already an indicator for this introduced. Such a simple thing. If I want to plot it to a chart, have to do it myself probably.– KozuchCommented Nov 8, 2013 at 12:40
-
Sites like Google and Yahoo offer that data plotted for you.– JTP - Apologise to Monica ♦Commented Nov 8, 2013 at 14:44
Add a comment
|
1 Answer
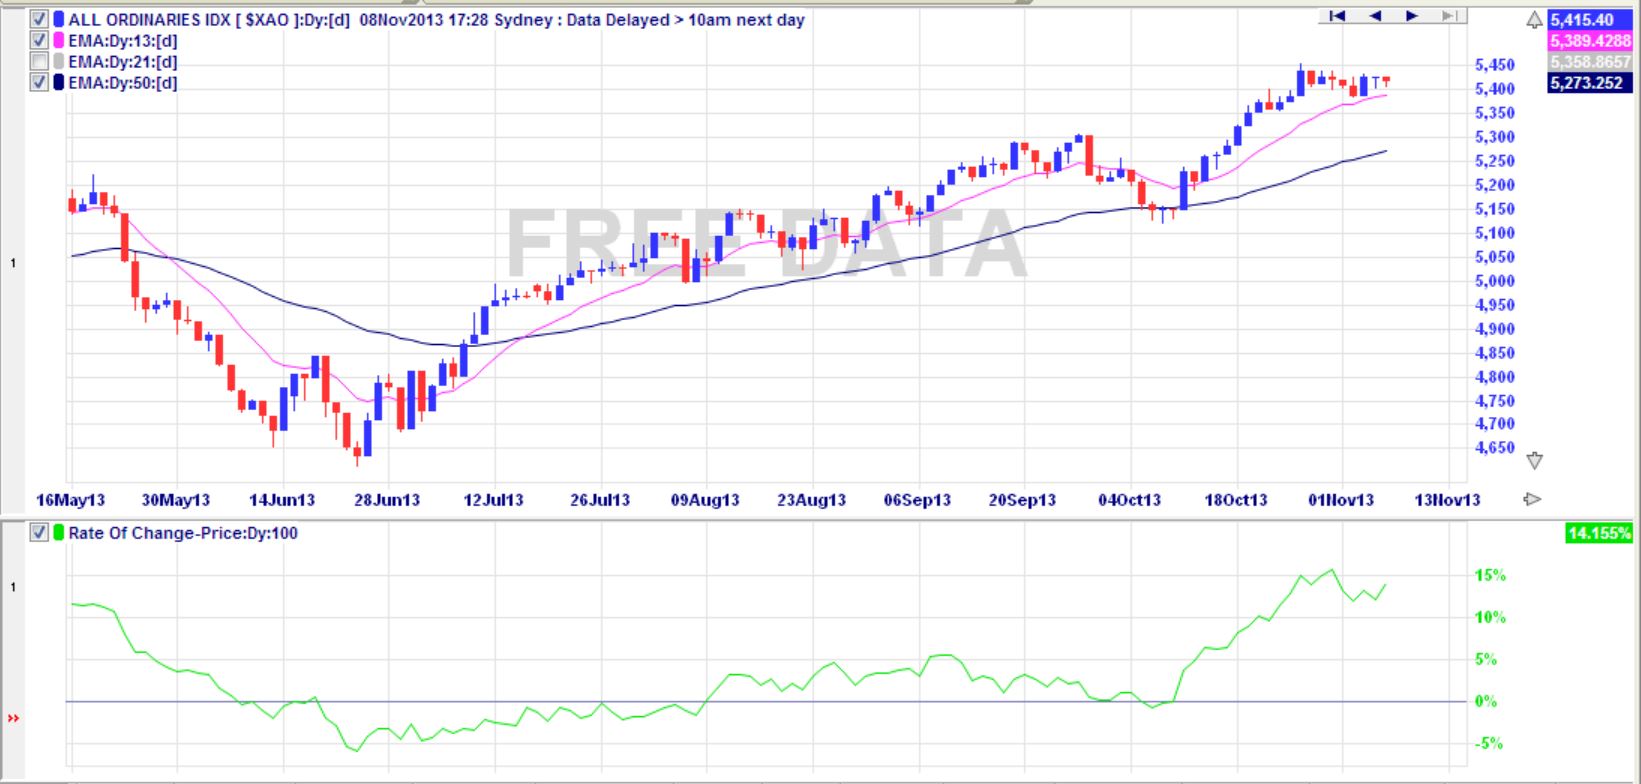
What you are looking for is an indicator called the "Rate of Change (Price)". It provides a rolling % change in the price over the period you have chosen.
Below is an example showing a price chart over the last 6 months with a 100 day Rate of Change indicator below the price chart.

