0

This is a follow-up to the question: How does the bloomberg website chart calculate the MACD?

When selecting a quote in the Bloomberg Market site (e.g. this quote), you are given the choice to add several indicators apart from the MACD. One of them being the "Rate of Change" (ROC).

I would like to know how it is calculated since the values shown don't seem to match the typical definitions for rate of change.

I don't have enough rep points to post images, so please find relevant screenshots in the next URLs:

2
  • Where do you see ‘rate of change’ on the chart? Could you include a screenshot?
    – xirt
    Commented Dec 17, 2017 at 1:11
  • I edited the post to include requested screenshots. Thx @xirt !
    – 1konejo
    Commented Dec 17, 2017 at 6:18

3 Answers 3

1

ROC determines the momentum behind price movements; it measures it either as percent change or price difference. For the most part, price and ROC should move together. When the price and ROC diverge, look for the ROC to be a clearer indication of the underlying momentum of the trend.

ROC Calculation

ROC = ( Current Price - Price N periods ago ) / Price N periods ago

where:
N Period = For daily, N=days; weekly, N=weeks, ... ROC omits non-trading days from computations.

Source: TECH ROC <GO>

Edit:
Clarify that this is Bloomberg's documentation on technical indicators, not my own words.

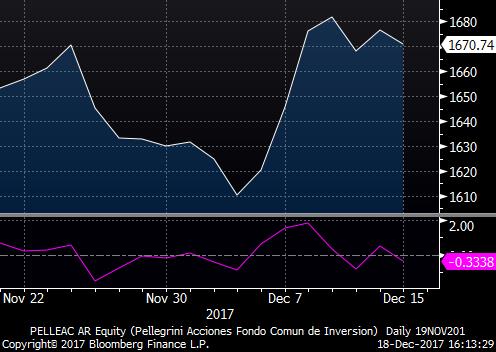
This is how it looks in the terminal: PELLEAC AR Equity ROC

3
  • I am puzzled because I used this 'typical' definition of ROC to try to solve the equation for the last datapoint of the quote in the question to figure out the number of periods Bloomberg was using. But the result made no sense as I mention in xirt's answer above.
    – 1konejo
    Commented Dec 17, 2017 at 22:33
  • This is very interesting indeed, @hroptatyr! Bloomberg's Terminal "Rate of Change" is quite different from the "Rate of Change" that they show in their public website. Please, notice the big differences in the trendline for my screenshot, the scale is very similar in both plots (imgur.com/C39bx23). I'm afraid I don't have Terminal available but, could you check if you have any indicator there with a similar profile to that of the website? Maybe we could figure out that way, what is that they are actually using. Thx!
    – 1konejo
    Commented Dec 18, 2017 at 20:05
  • I'm not a "technical indicator" guy but from what I can see when I set the ranges to those of the website it's exactly the same chart, a ROC(1), i.e. N = 1, simply the scale seems to be different, it seems they use the 4W-high/low (of the indicator) to define 100 and display all values relative to that.
    – hroptatyr
    Commented Dec 19, 2017 at 4:29
1

I was finally able to figure out that the so called "Rate of Change" that Bloomberg is displaying on its website is simply a substruction of the daily closing price minus the closing price 5 days before. It is not a ratio.

Website "ROC" calculation:

w-ROC = Current price - Price 5 days ago

It also omits non-trading days from computations.

I thank user @hroptatyr for helpful discussions that allowed me to get to this conclusion.

0

Rate of Change can be calculated in a number of ways. From a theoretical standpoint, it is simply the change from one datapoint to the next. However, in practice, in order to 'clean up the data' people often use filter. Such a filter could be to use a moving average rather than the most recent datapoint.

It is not clear what specific filters Bloomberg are using and they may regard their approach as proprietary (they generally charge quite a lot for such 'derived data').

I have tested the 'N periods ago' method against the dataset but there is not a close approximation.

I would suggest reviewing an academic text on stochastic indicators or signal processing algorithms for specific approaches. You may find some that provide a close approximation to Bloomberg's own indicators if configured with the appropriate parameters.

1
  • Indeed @xirt, I tried to solve the equation for the latest datapoint in order to figure out what 'N periods ago' price they were using and came to a price which was higher than the historical maximum for that quote, which made no sense. I noticed though, that when Bloomberg's ROC crosses the x-axis, it approximately coincides with a max or min for the MACD indicator for the quote in question. Maybe this ROC is some sort of first derivative of the MACD? I'll keep on looking for more info and make new tests.
    – 1konejo
    Commented Dec 17, 2017 at 22:25

You must log in to answer this question.

Not the answer you're looking for? Browse other questions tagged .