also deleted old charts that assumed annual contribution of $5k
Source Link
base64
  • 10.5k
  • 2
  • 26
  • 39

Final Edit: End Value of 60/40(10-Year Treasury) is worse than S&P 500.

Instead of blindly deriving the Bonds Fund price from Yield to Maturity, this time using the oldest available proxy to 10-Year Treasury Index (i.e. Lehman/Barclays/Bloomberg) which are the following Mutual Funds in 6:4 Ratio:

  • Vanguard Intermediate-Term Treasury Fund Investor Shares (VFITX), duration 5.2 years, inception 10/28/1991
  • Vanguard Long-Term Treasury Fund Investor Shares (VUSTX), duration 18.0 years, inception 05/19/1986

and:

  • Vanguard Total Stock Market Index Fund Investor Shares (VTSMX), inception 04/27/1992

In the following charts:

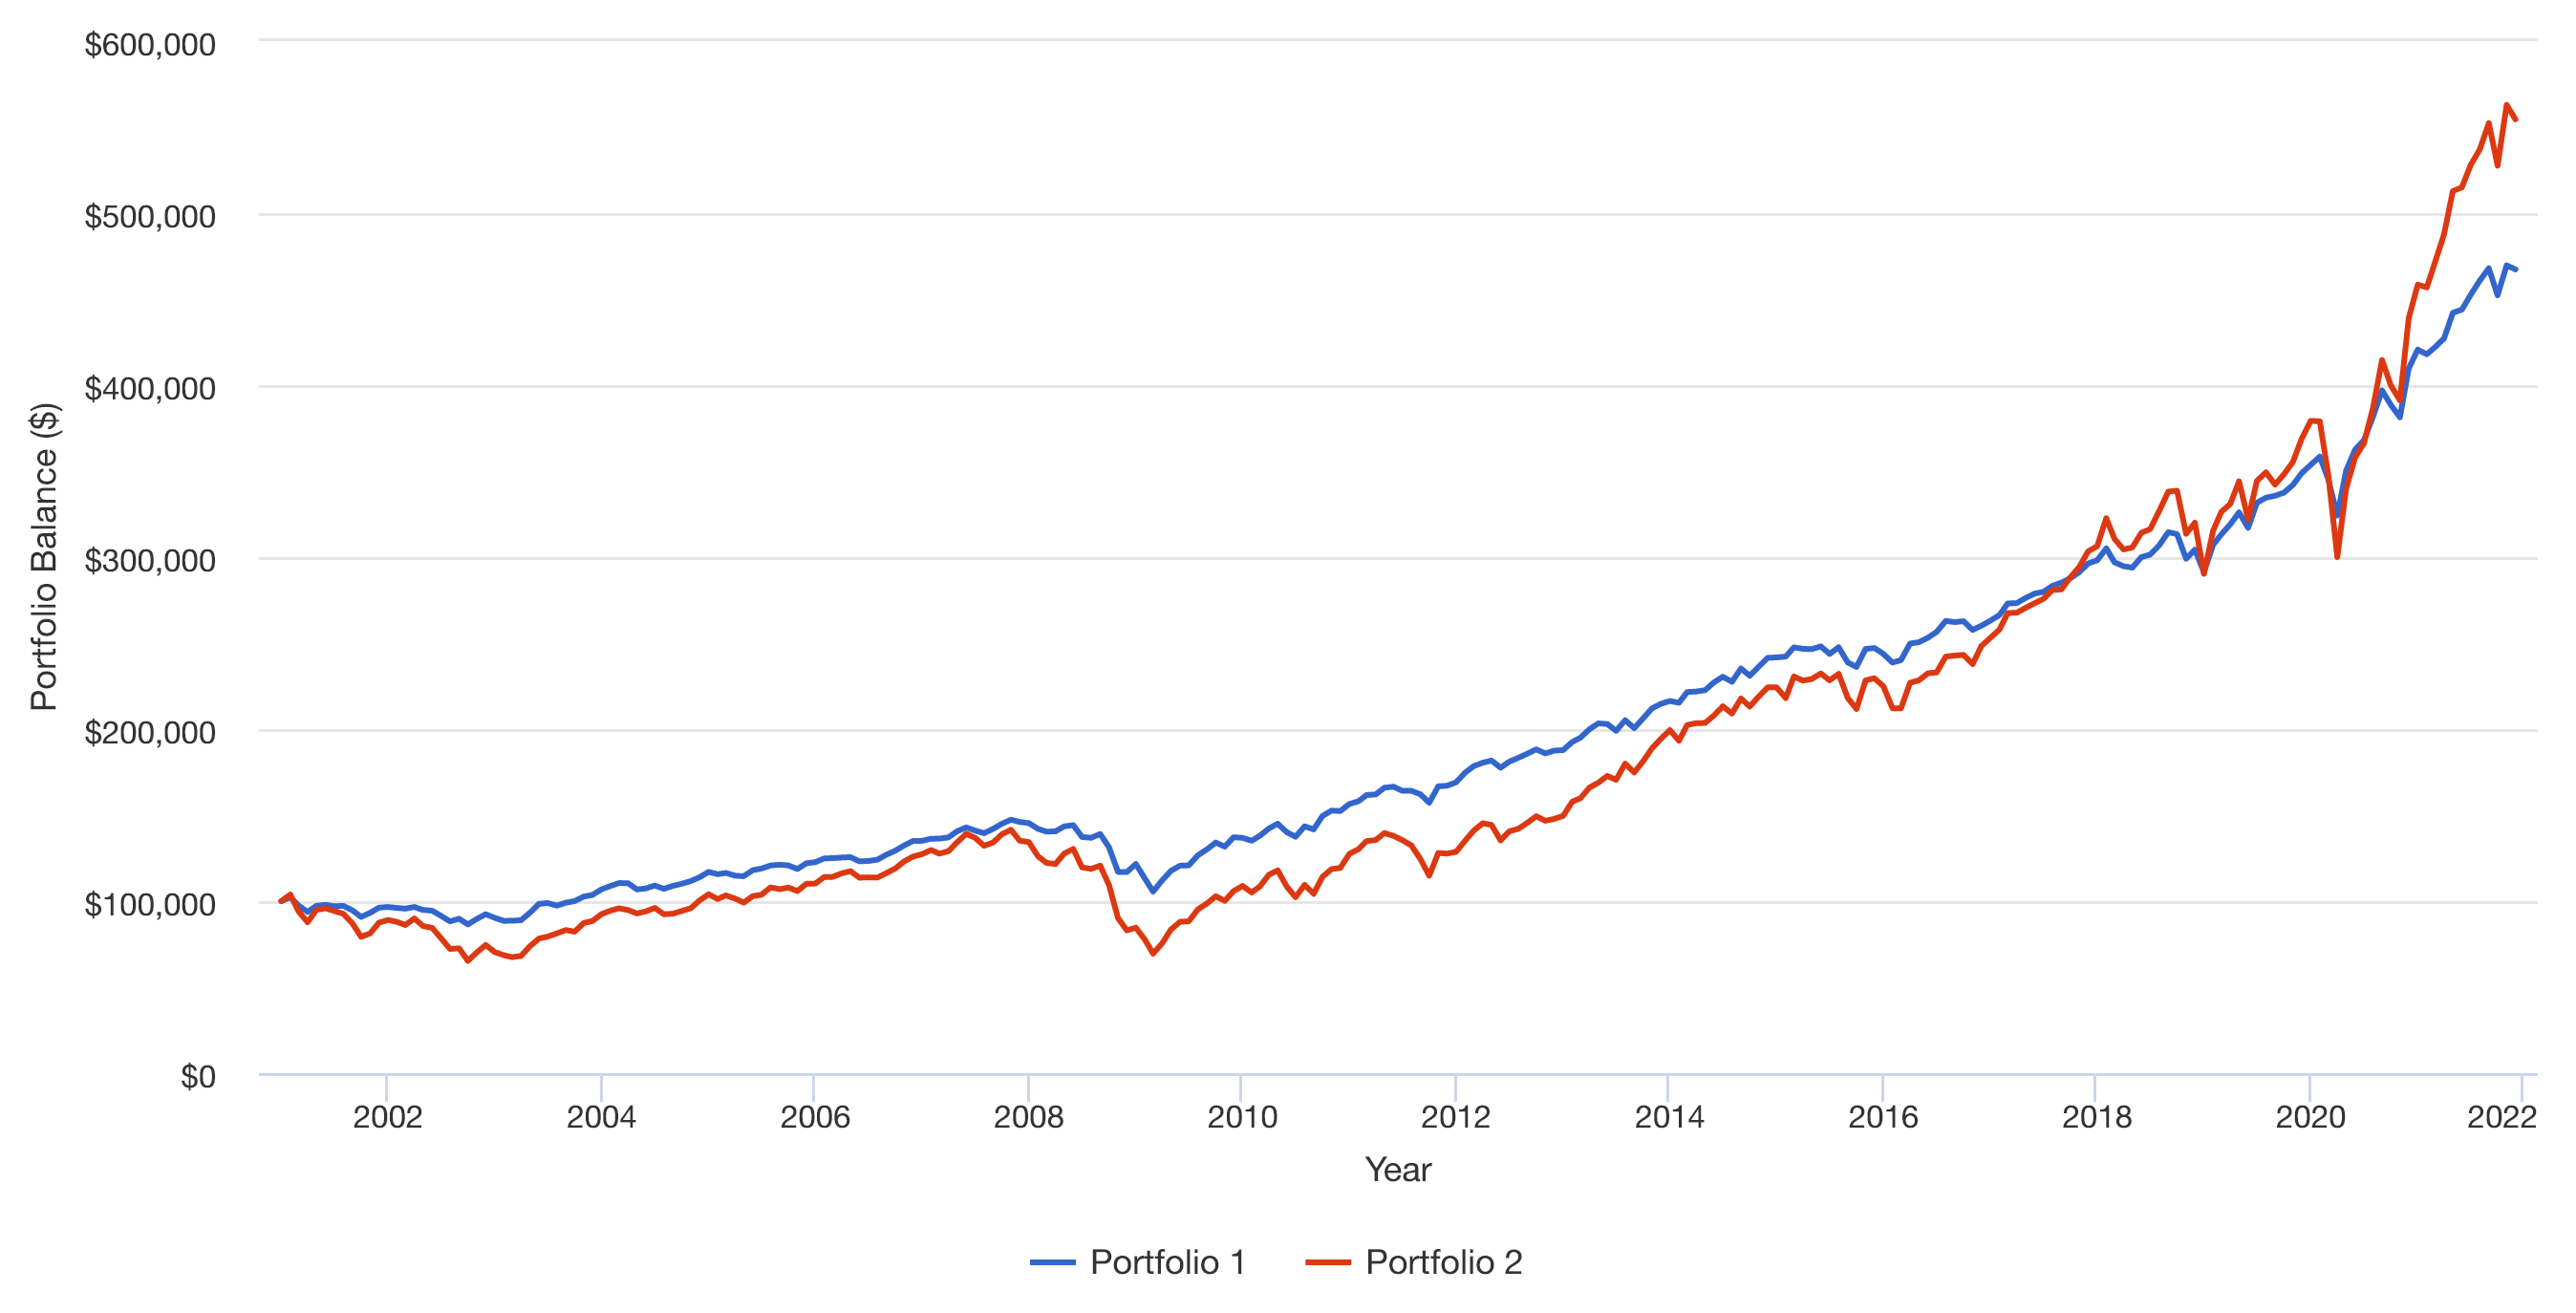
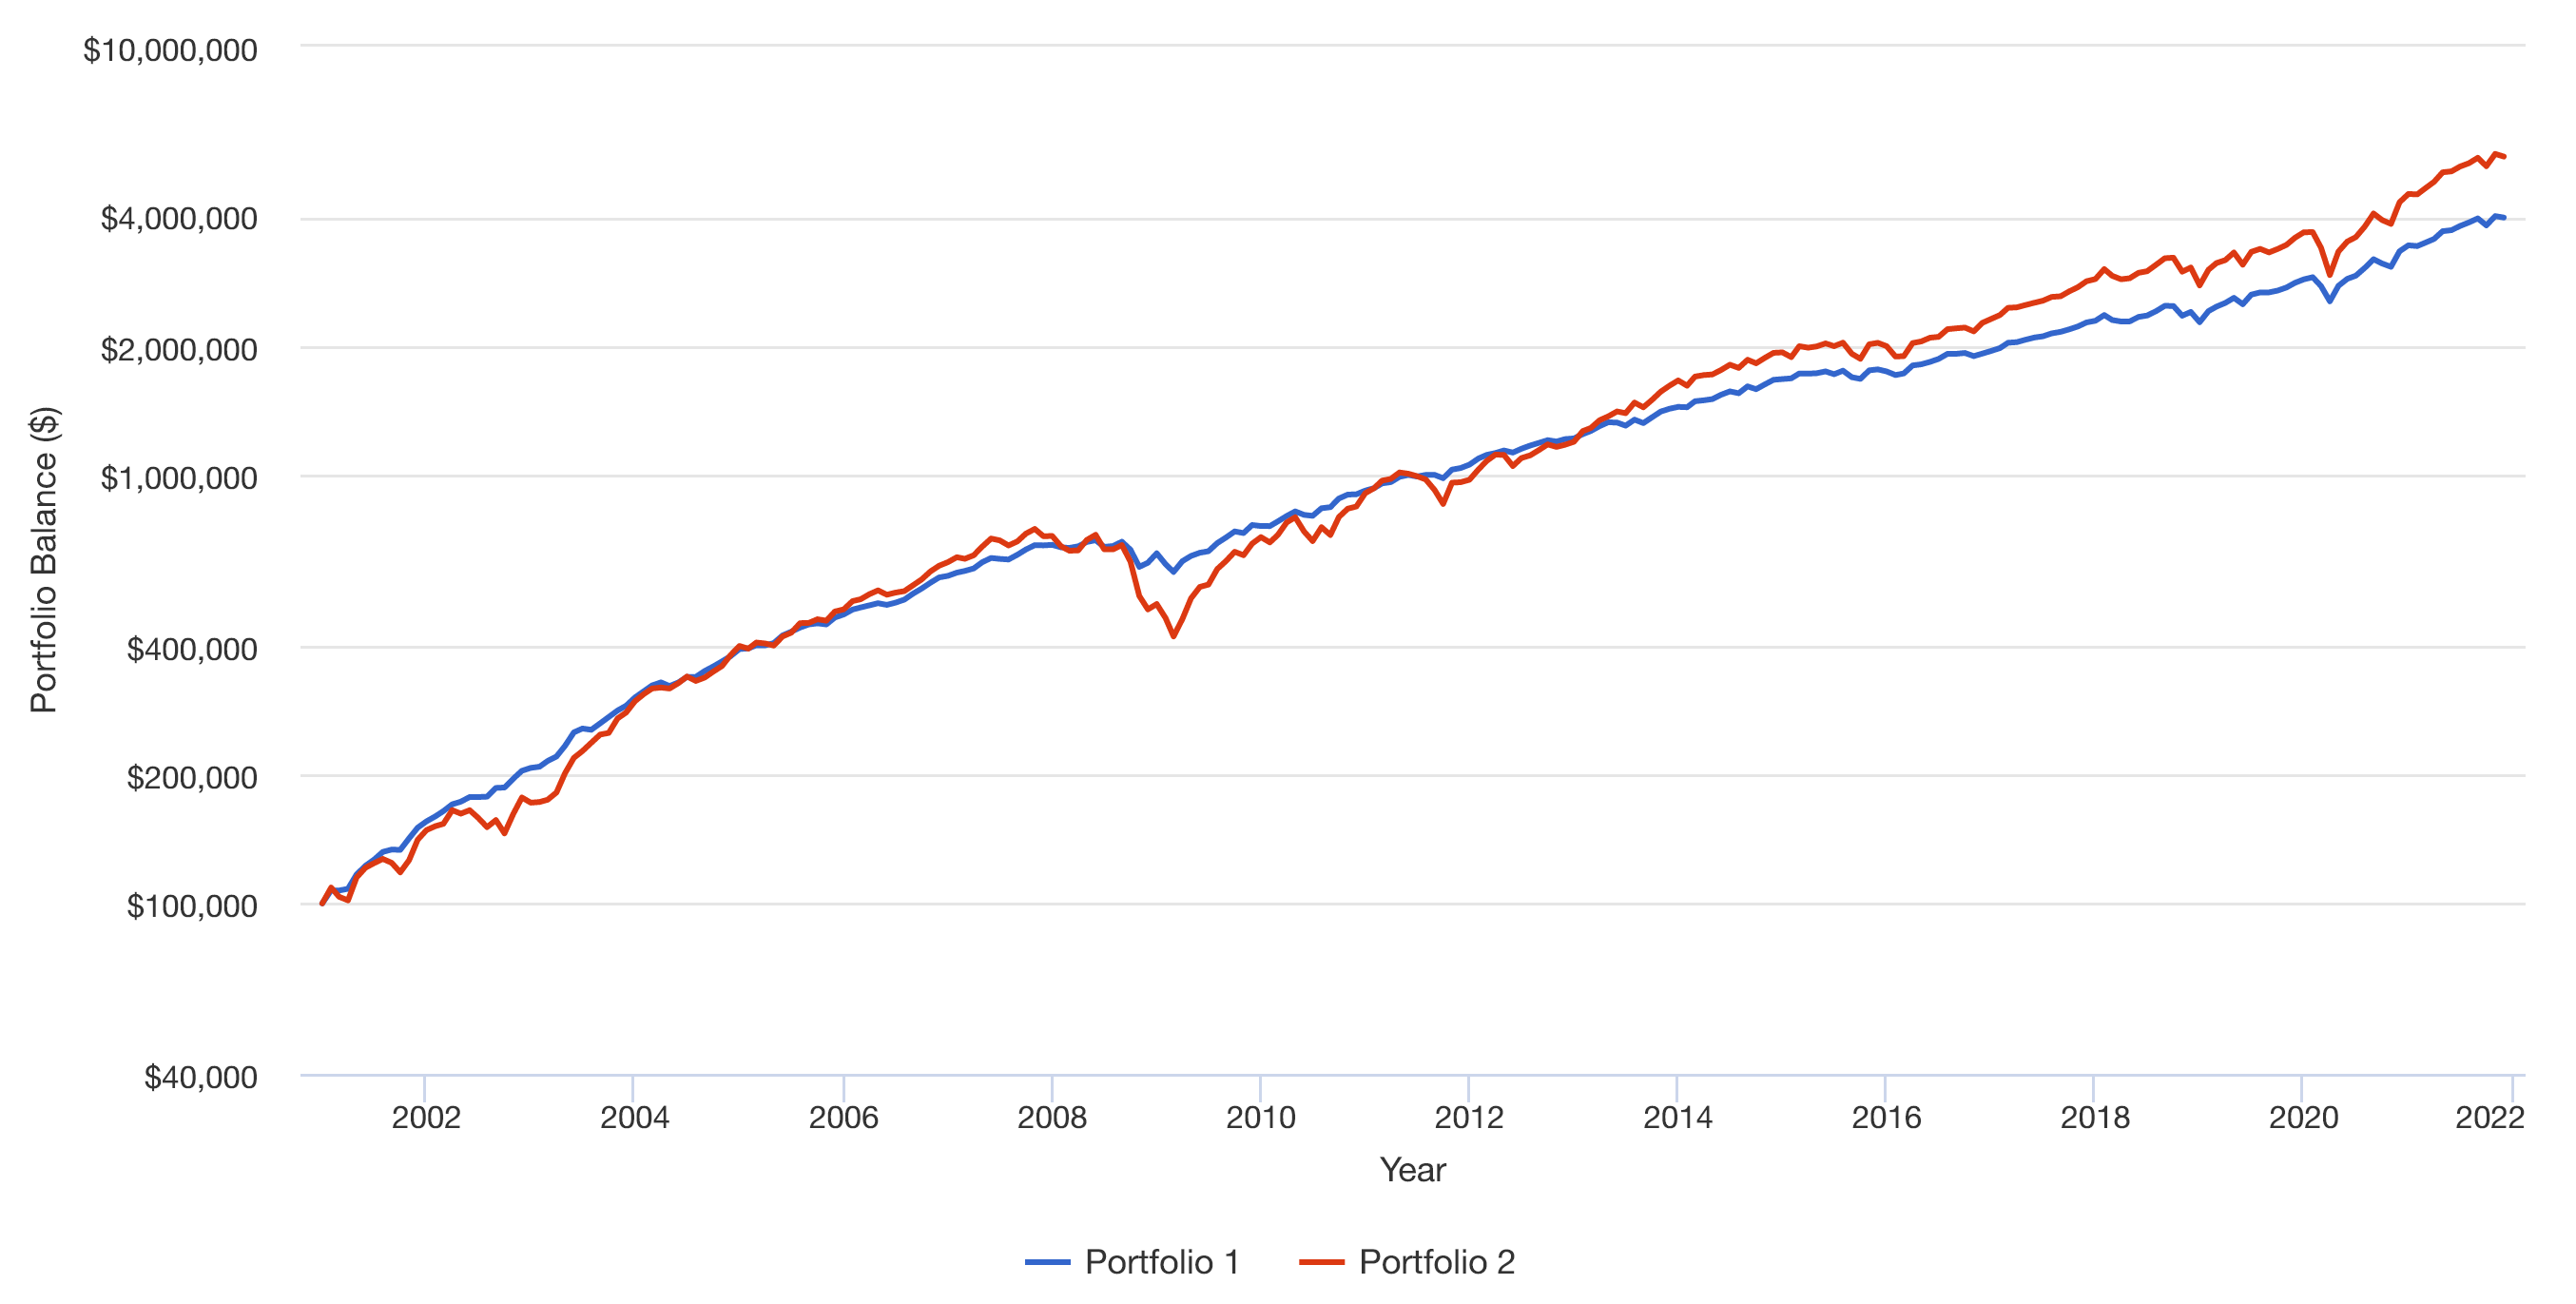
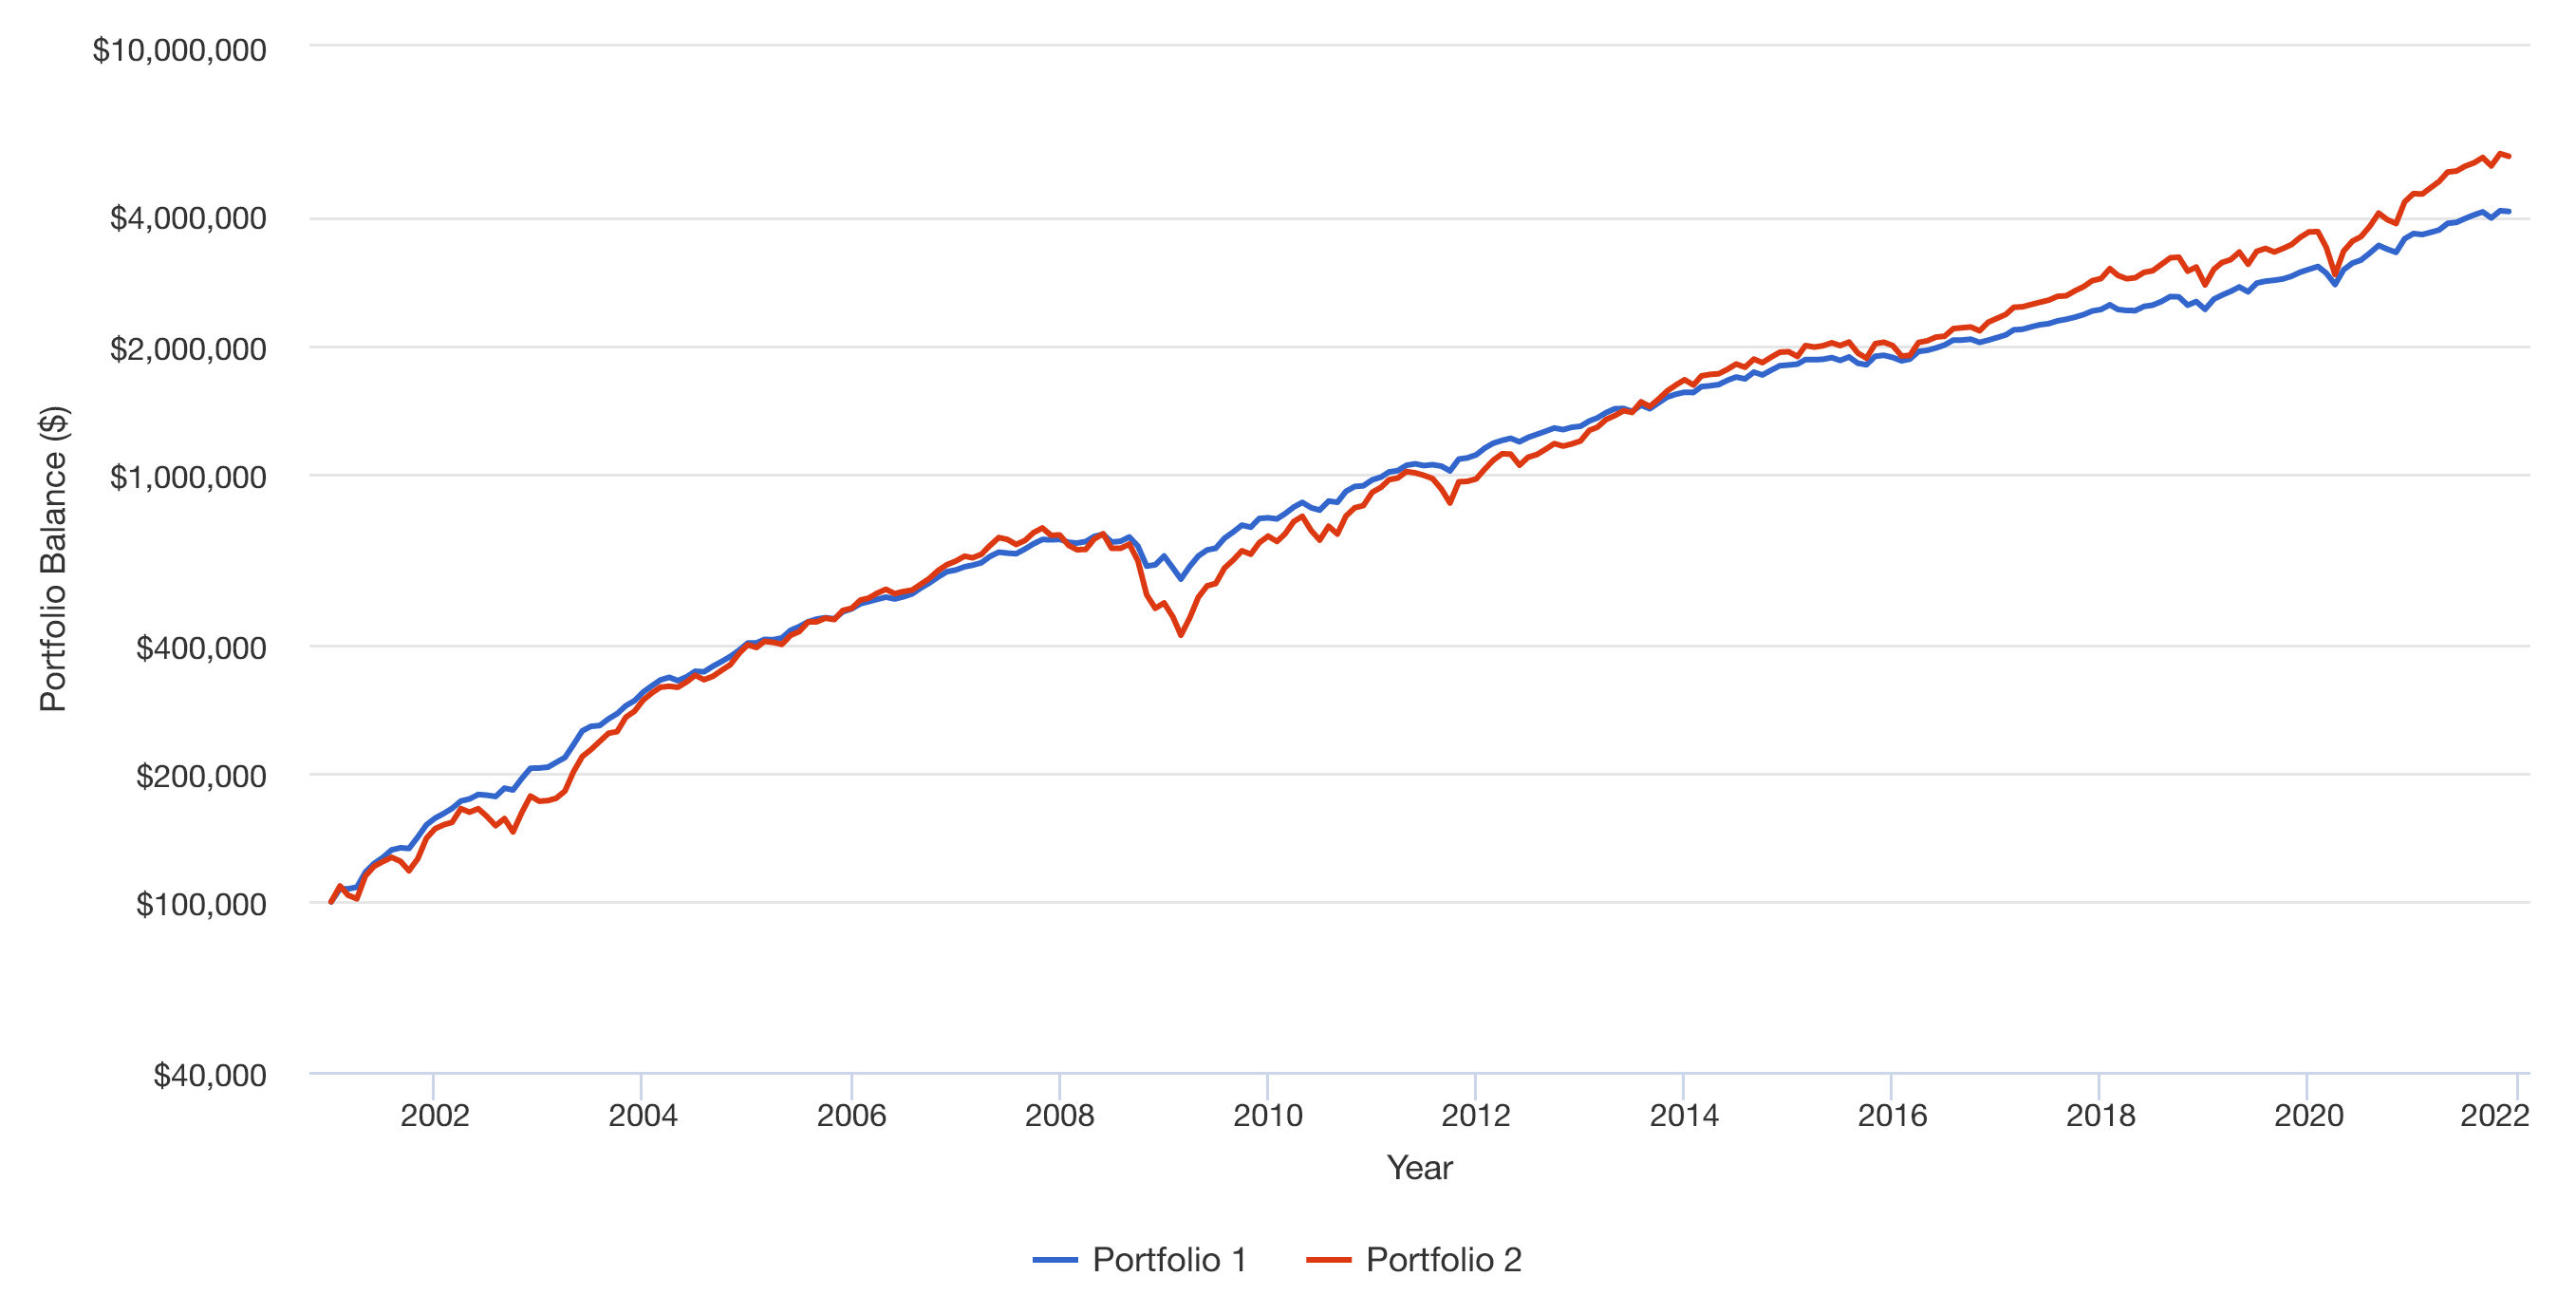
  • Portfolio 1 represents 60% S&P 500 (VTSMX), 24% VFITX + 16% VUSTX (10-year Treasury)
  • Portfolio 2 100% S&P 500 (VTSMX)

Assume Montly Rebalancing because that is how balanced funds and the index works.

$100k Lump Sum with Monthly Rebalancing = False

G

$100k Lump Sum and $5k Monthly Dollar Cost Averaging with Monthly Rebalancing = False

G2


Edit: After discussing with the author on their assumptions.

enter image description here

$100k Lump Sum and $5k Monthly Dollar Cost Averaging with No Rebalancing = False

enter image description here

$100k Lump Sum and $5k Monthly Dollar Cost Averaging with Quarterly Rebalancing = False

enter image description here

Edit: After discussing with the author on their assumptions.

enter image description here

$100k Lump Sum and $5k Monthly Dollar Cost Averaging with No Rebalancing = False

enter image description here

$100k Lump Sum and $5k Monthly Dollar Cost Averaging with Quarterly Rebalancing = False
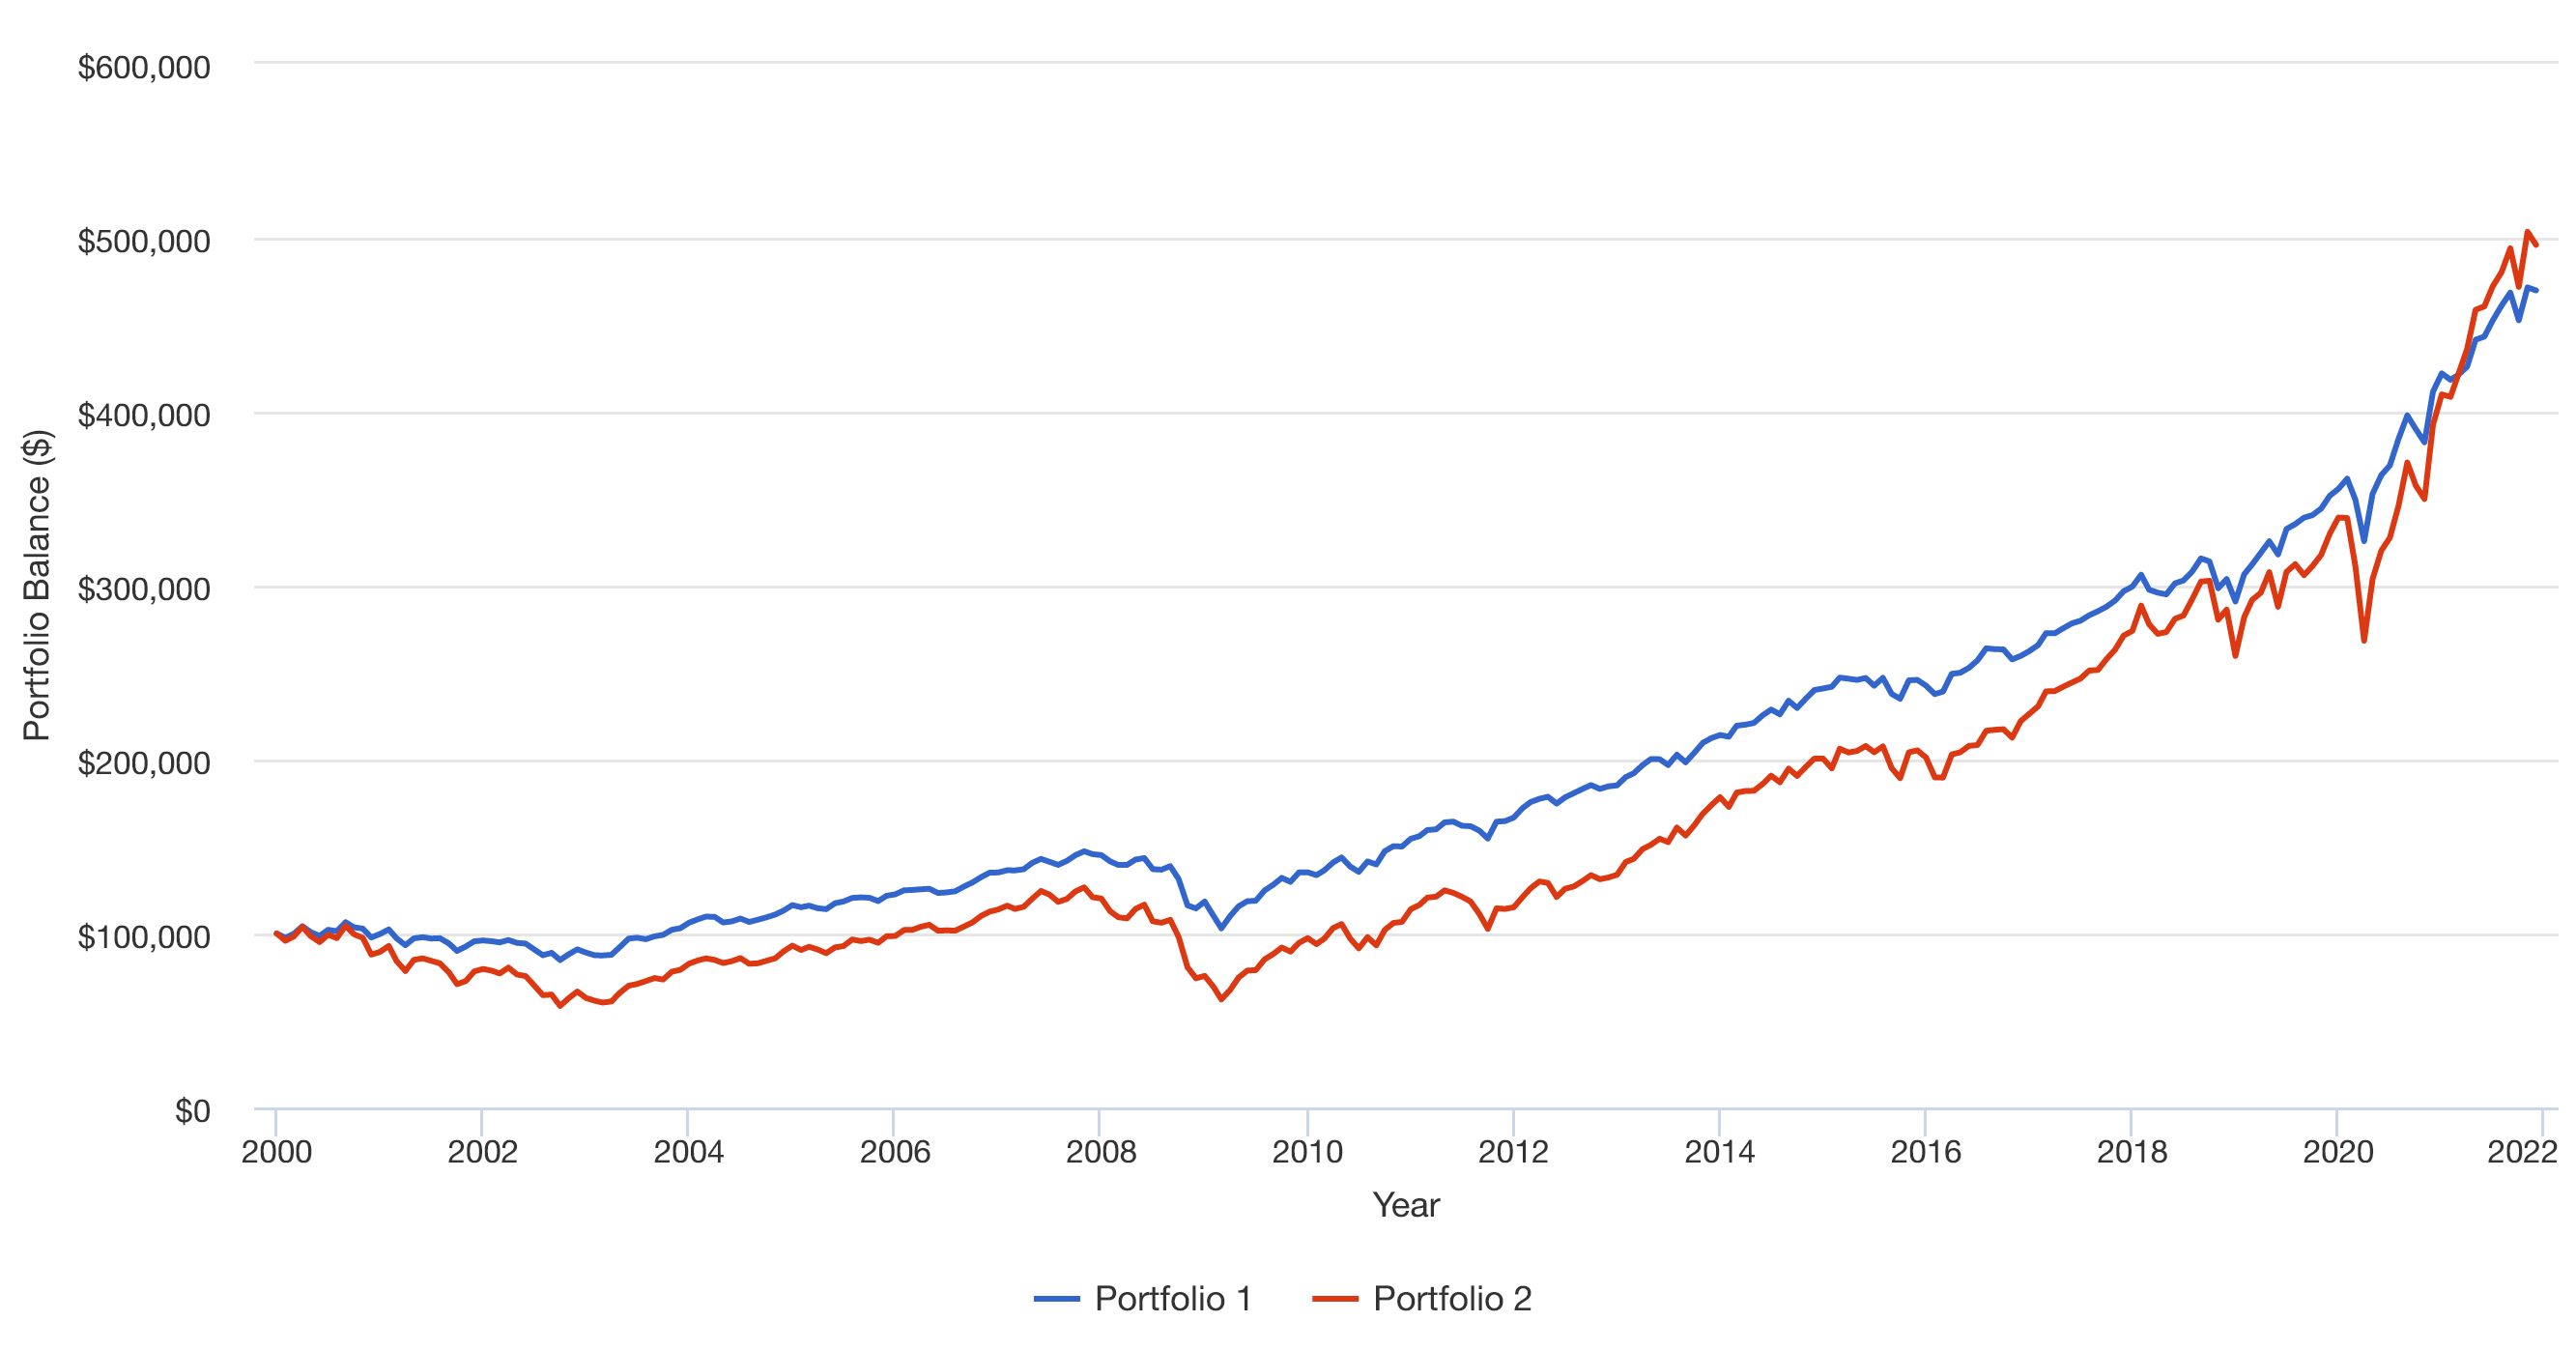
enter image description here

Final Edit: End Value of 60/40(10-Year Treasury) is worse than S&P 500.

Instead of blindly deriving the Bonds Fund price from Yield to Maturity, this time using the oldest available proxy to 10-Year Treasury Index (i.e. Lehman/Barclays/Bloomberg) which are the following Mutual Funds in 6:4 Ratio:

  • Vanguard Intermediate-Term Treasury Fund Investor Shares (VFITX), duration 5.2 years, inception 10/28/1991
  • Vanguard Long-Term Treasury Fund Investor Shares (VUSTX), duration 18.0 years, inception 05/19/1986

and:

  • Vanguard Total Stock Market Index Fund Investor Shares (VTSMX), inception 04/27/1992

In the following charts:

  • Portfolio 1 represents 60% S&P 500 (VTSMX), 24% VFITX + 16% VUSTX (10-year Treasury)
  • Portfolio 2 100% S&P 500 (VTSMX)

Assume Montly Rebalancing because that is how balanced funds and the index works.

$100k Lump Sum with Monthly Rebalancing = False

G

$100k Lump Sum and $5k Monthly Dollar Cost Averaging with Monthly Rebalancing = False

G2


Edit: After discussing with the author on their assumptions.

enter image description here

added 372 characters in body
Source Link
base64
  • 10.5k
  • 2
  • 26
  • 39

For example, using this calculation methodology, the total return from 2008 to 2021 is 225%, yet when using 60% SPY, 28% IEF, 12% TLH, it is 219%.

This further reinforces that deriving Bonds Price with only Yield to Maturity is an incorrect method, and that this discussion should have started with Total Bonds Market Index with monthly rebalancing, minus realistic tracking error, to begin with.

Still, it is not known how the author calculated 425.9% total return for 60/40 Portfolio.

C

C

For example, using this calculation methodology, the total return from 2008 to 2021 is 225%, yet when using 60% SPY, 28% IEF, 12% TLH, it is 219%.

This further reinforces that deriving Bonds Price with only Yield to Maturity is an incorrect method, and that this discussion should have started with Total Bonds Market Index with monthly rebalancing, minus realistic tracking error, to begin with.

Still, it is not known how the author calculated 425.9% total return for 60/40 Portfolio.

C

added 1049 characters in body
Source Link
base64
  • 10.5k
  • 2
  • 26
  • 39

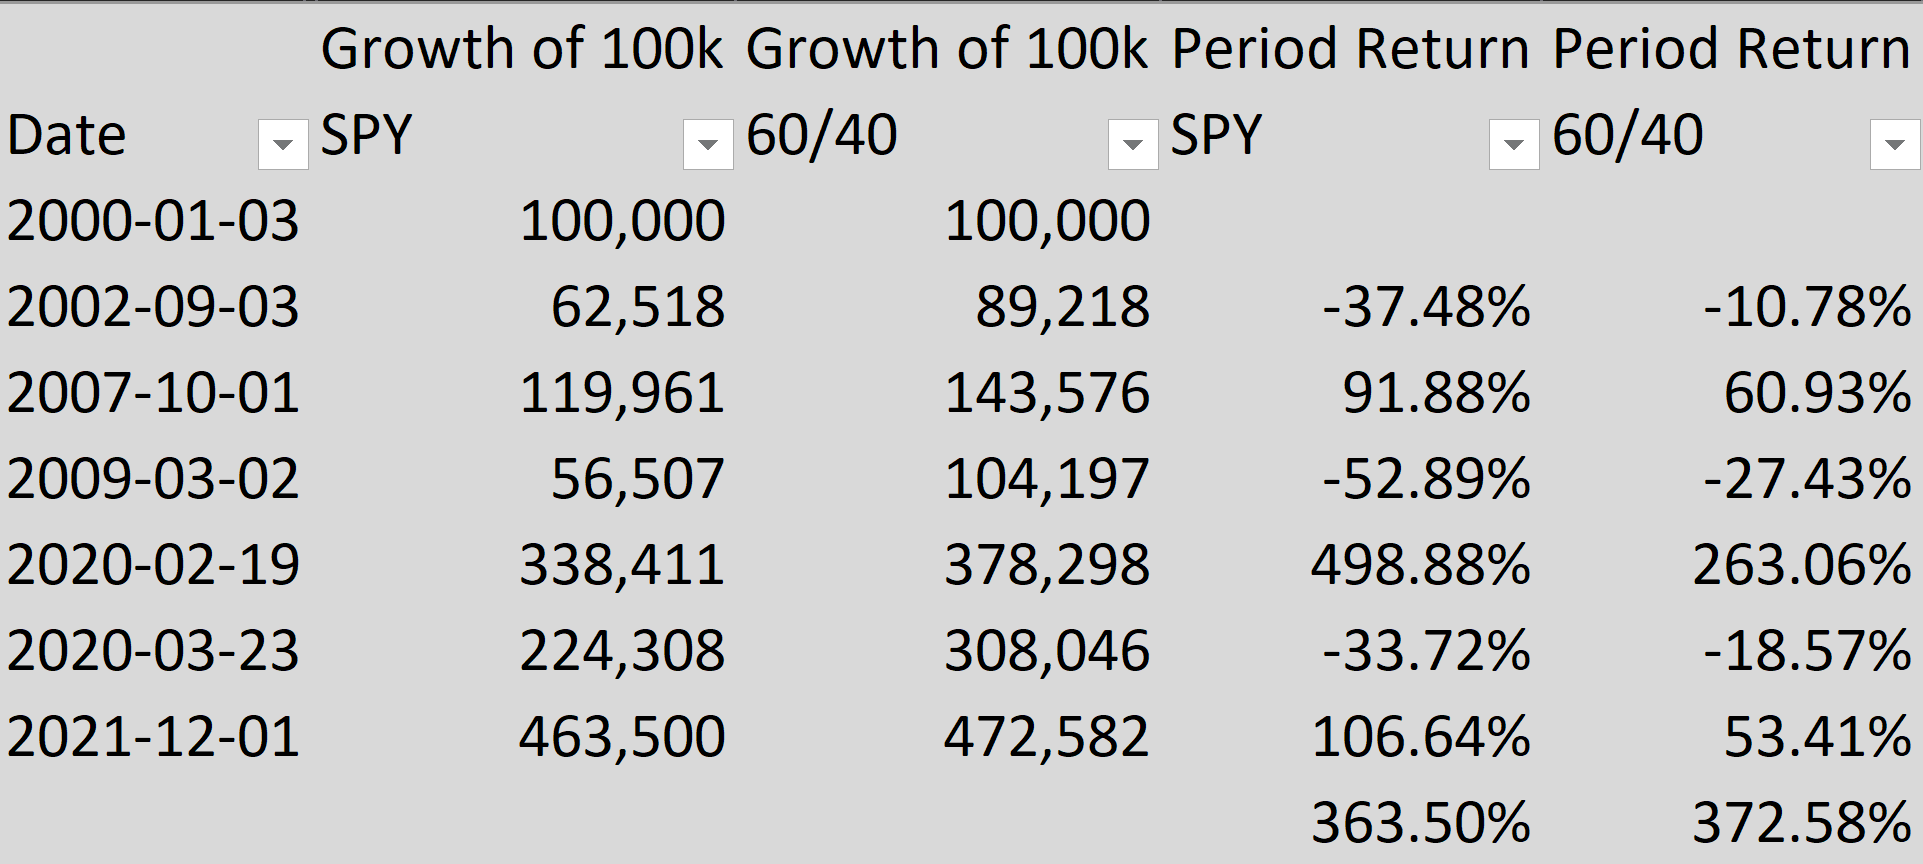
Edit 2: Using this calculation methodology (especially daily rebalancing) and including YTM that are realized (i.e. daily interest as income), the result is that 60/40 is slightly better than S&P 500.

However, practically this is debatable, especially when S&P 500 Total Return Index is much higher than Yahoo Finance Adjusted Return (372% vs 363%), and that Bonds market is inefficient with high bid/ask spread.

When using Passive Bonds Funds (Mutual Fund or ETF), I have yet to see that this calculation methodology is realistic. If you go to Morningstar and look for Active Balanced Funds since 2000, there will always be Outperforming Funds and Underperforming Funds. But if you look at those benchmarked at S&P 500/AGG, the outperformance with 100% S&P 500 didn't happen.

C

D

Raw Data, Formula, and Excel files here: https://www.mediafire.com/file/n7unzo2kypjhk5n/6040_vs_SPY_with_Bonds_Interest.xlsx/file


If you look at the definition of "60/40 stock/bond portfolio" at 24:14 of the video, it says:

If you look at the definition of "60/40 stock/bond portfolio" at 24:14 of the video, it says:

Edit 2: Using this calculation methodology (especially daily rebalancing) and including YTM that are realized (i.e. daily interest as income), the result is that 60/40 is slightly better than S&P 500.

However, practically this is debatable, especially when S&P 500 Total Return Index is much higher than Yahoo Finance Adjusted Return (372% vs 363%), and that Bonds market is inefficient with high bid/ask spread.

When using Passive Bonds Funds (Mutual Fund or ETF), I have yet to see that this calculation methodology is realistic. If you go to Morningstar and look for Active Balanced Funds since 2000, there will always be Outperforming Funds and Underperforming Funds. But if you look at those benchmarked at S&P 500/AGG, the outperformance with 100% S&P 500 didn't happen.

C

D

Raw Data, Formula, and Excel files here: https://www.mediafire.com/file/n7unzo2kypjhk5n/6040_vs_SPY_with_Bonds_Interest.xlsx/file


If you look at the definition of "60/40 stock/bond portfolio" at 24:14 of the video, it says:

added 40 characters in body
Source Link
base64
  • 10.5k
  • 2
  • 26
  • 39
Loading
edited body
Source Link
base64
  • 10.5k
  • 2
  • 26
  • 39
Loading
added 1000 characters in body
Source Link
base64
  • 10.5k
  • 2
  • 26
  • 39
Loading
added 42 characters in body
Source Link
base64
  • 10.5k
  • 2
  • 26
  • 39
Loading
Source Link
base64
  • 10.5k
  • 2
  • 26
  • 39
Loading