Edit: After discussing with the author on their assumptions.
I hope we can settle the claim once and for all.
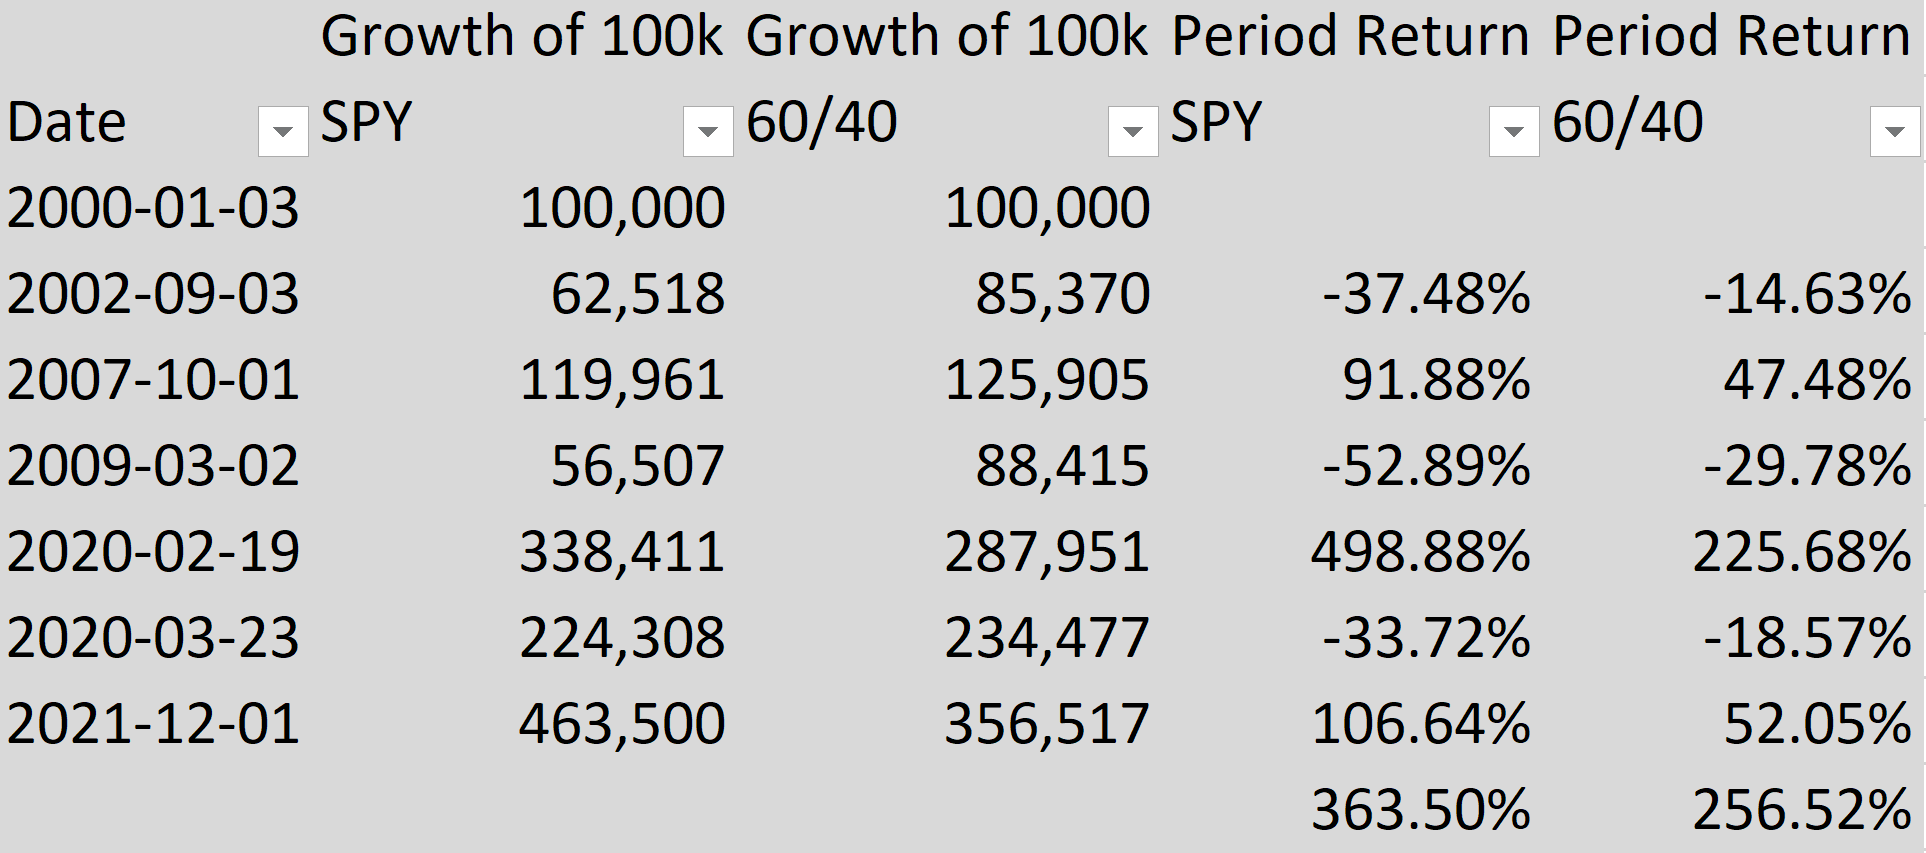
- S&P 500 = Adjusted Close with Yahoo Finance
- 10-year Treasury = Yield to Maturity from macrotrends.net, which I confirmed it to be extremely similar to treasury.gov
- Start Date = 2000-01-03
- End Date = 2021-12-01
- Lump Sum $100,000 with no additional funds
- Reinvested dividend
- "Continous Rebalancing" = Assume Daily Rebalancing
- No Bid/Ask Spread (theoretically TLH has 0.05% spread, which does add up daily.
- No Capital Gains or Divividend Tax
- Price of Bonds Fund = 100/((1+YTM/100)^10)
- A very smart Bonds Fund manager is able to maintain constant maturity (theoretically a 10-year Bonds becomes 9.997-year Bonds after 1 day. )
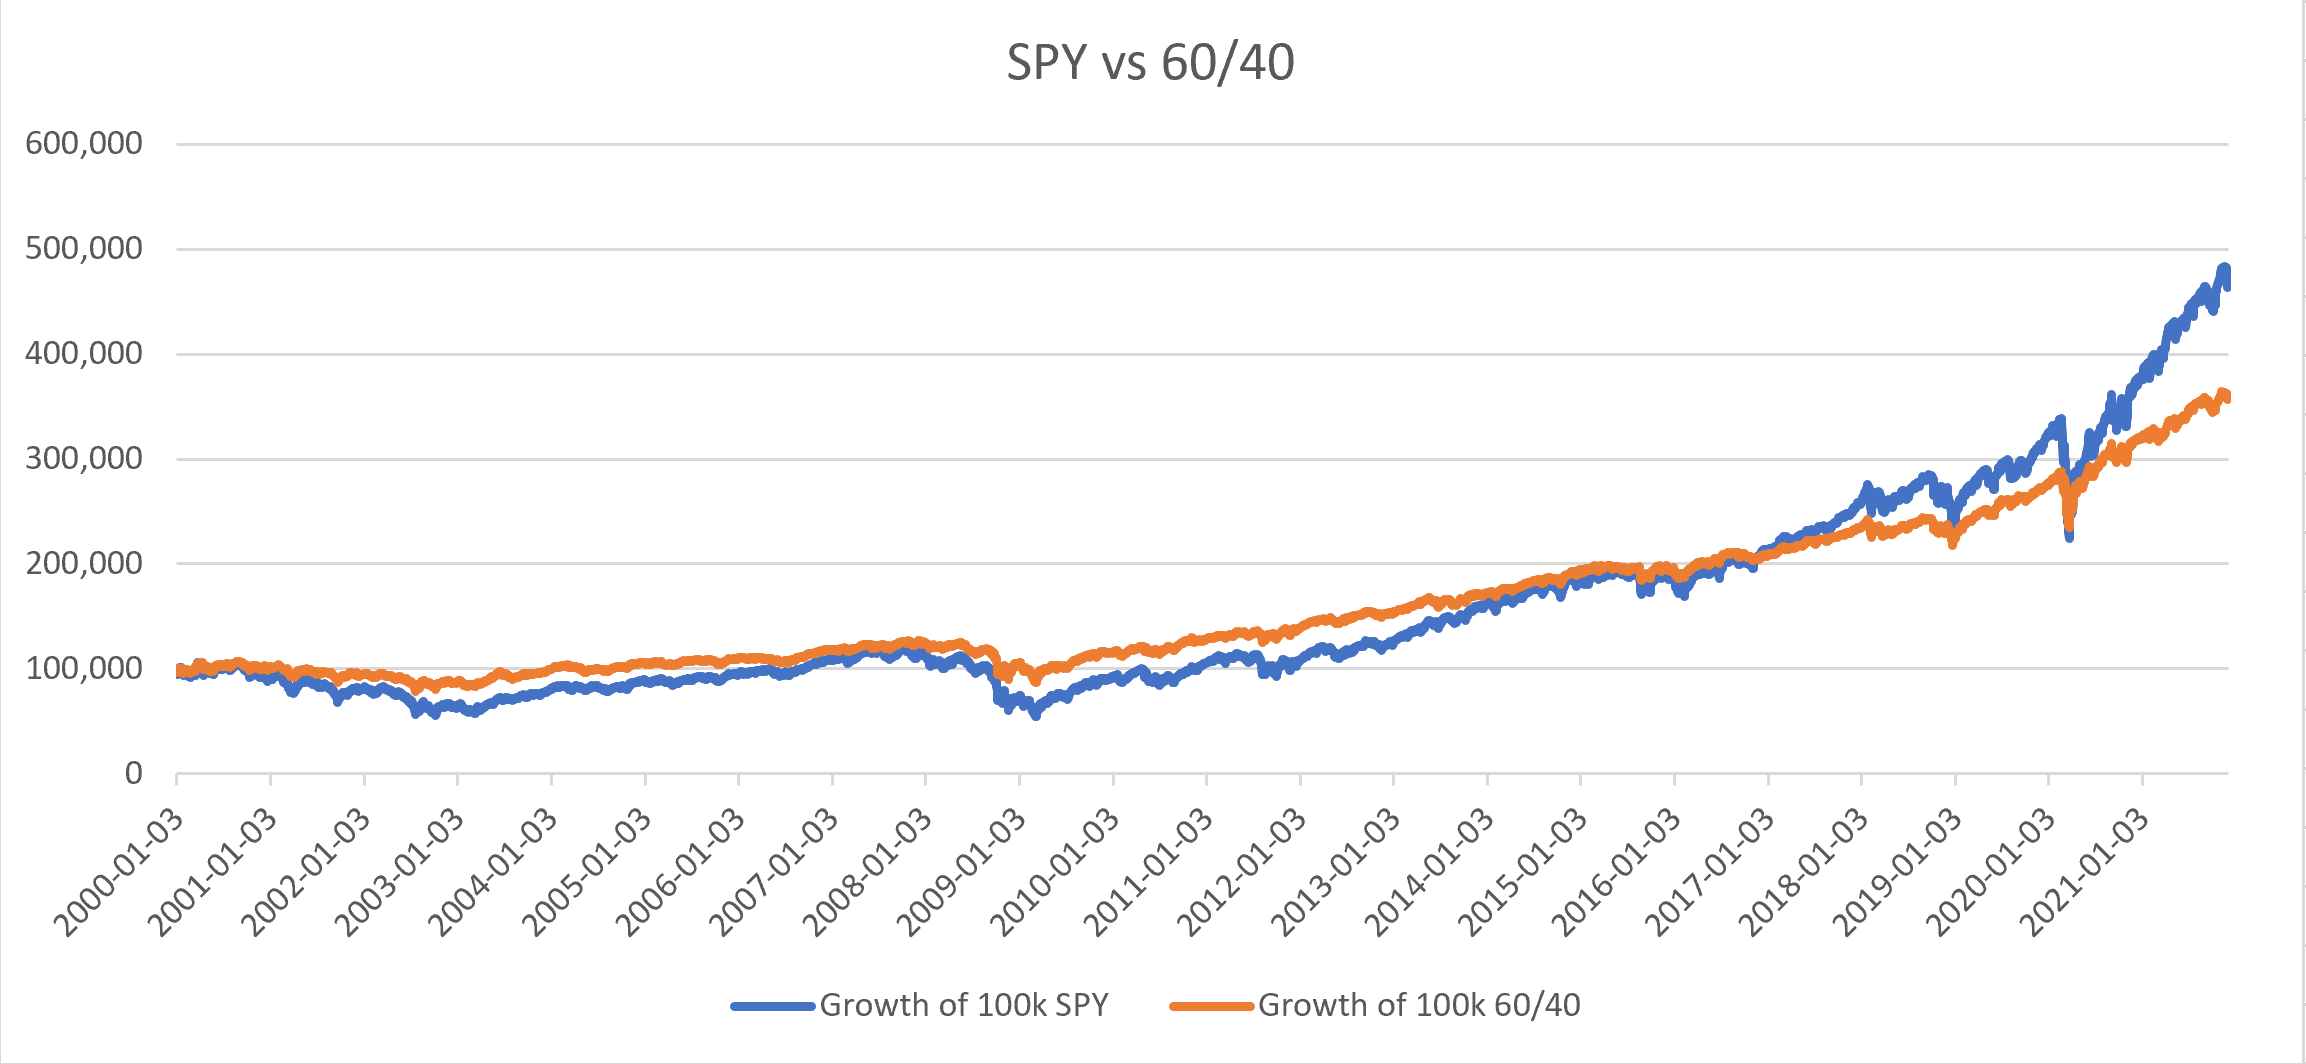
Result: End-Value of 60/40 is worse than 100% S&P 500.
Raw Data, Formula, and Excel files here: https://www.mediafire.com/file/p34fe2y7td4dchx/6040_vs_SPY.xlsx/file
If you look at the definition of "60/40 stock/bond portfolio" at 24:14 of the video, it says:
60/40 is 60% S&P 500 and 40% 10-year Treasury
This is the part where it is misleading. Treasury Bonds had a magnified great run in the past 20 years. The longer the duration of the Treasury, the higher return and lower volatility it brings.
This 60/40 is different from the Modern Portfolio Theory, where the "Market Portfolio" is 60% Total Stock Market and 40% Total Bonds Market (including Treasury, Corporate, Municipal, Junk, etc).
So instead of 40% BND ETF that Bogleheads recommended, the 10-year Treasury is simulated by IEF ETF and TLH ETF on a 7:3 Ratio.
They could have made it more misleading by using 20-25 years Treasury (i.e. TLT and EDV ETF).
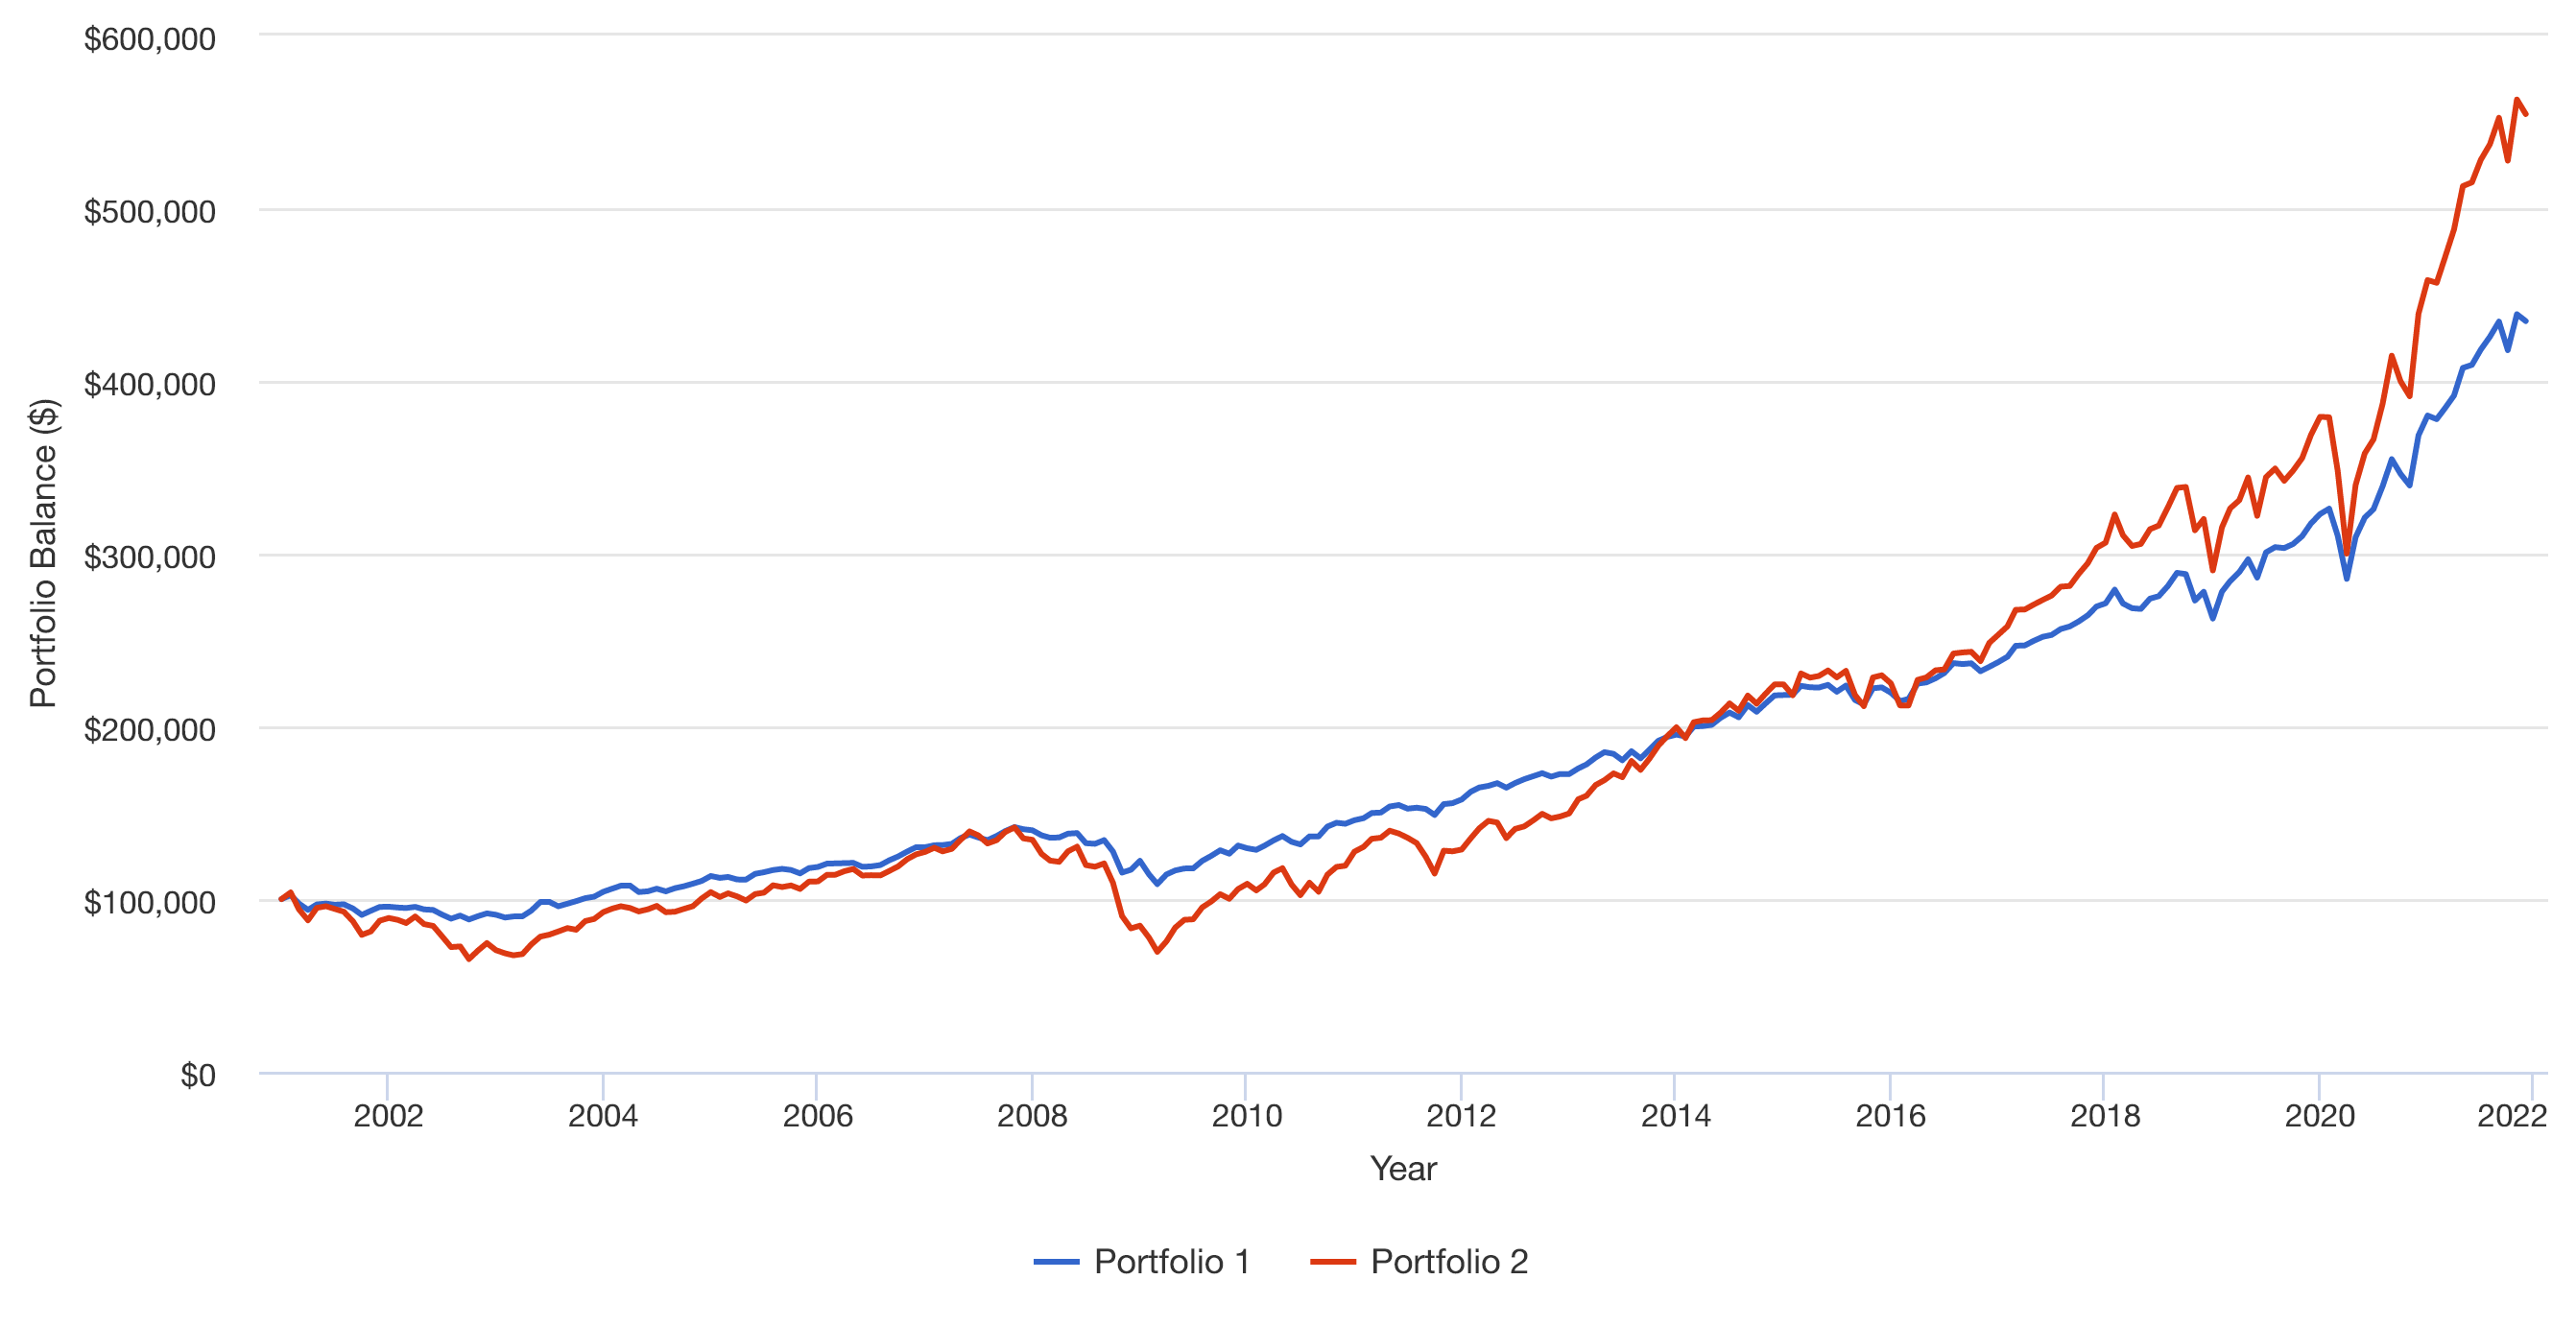
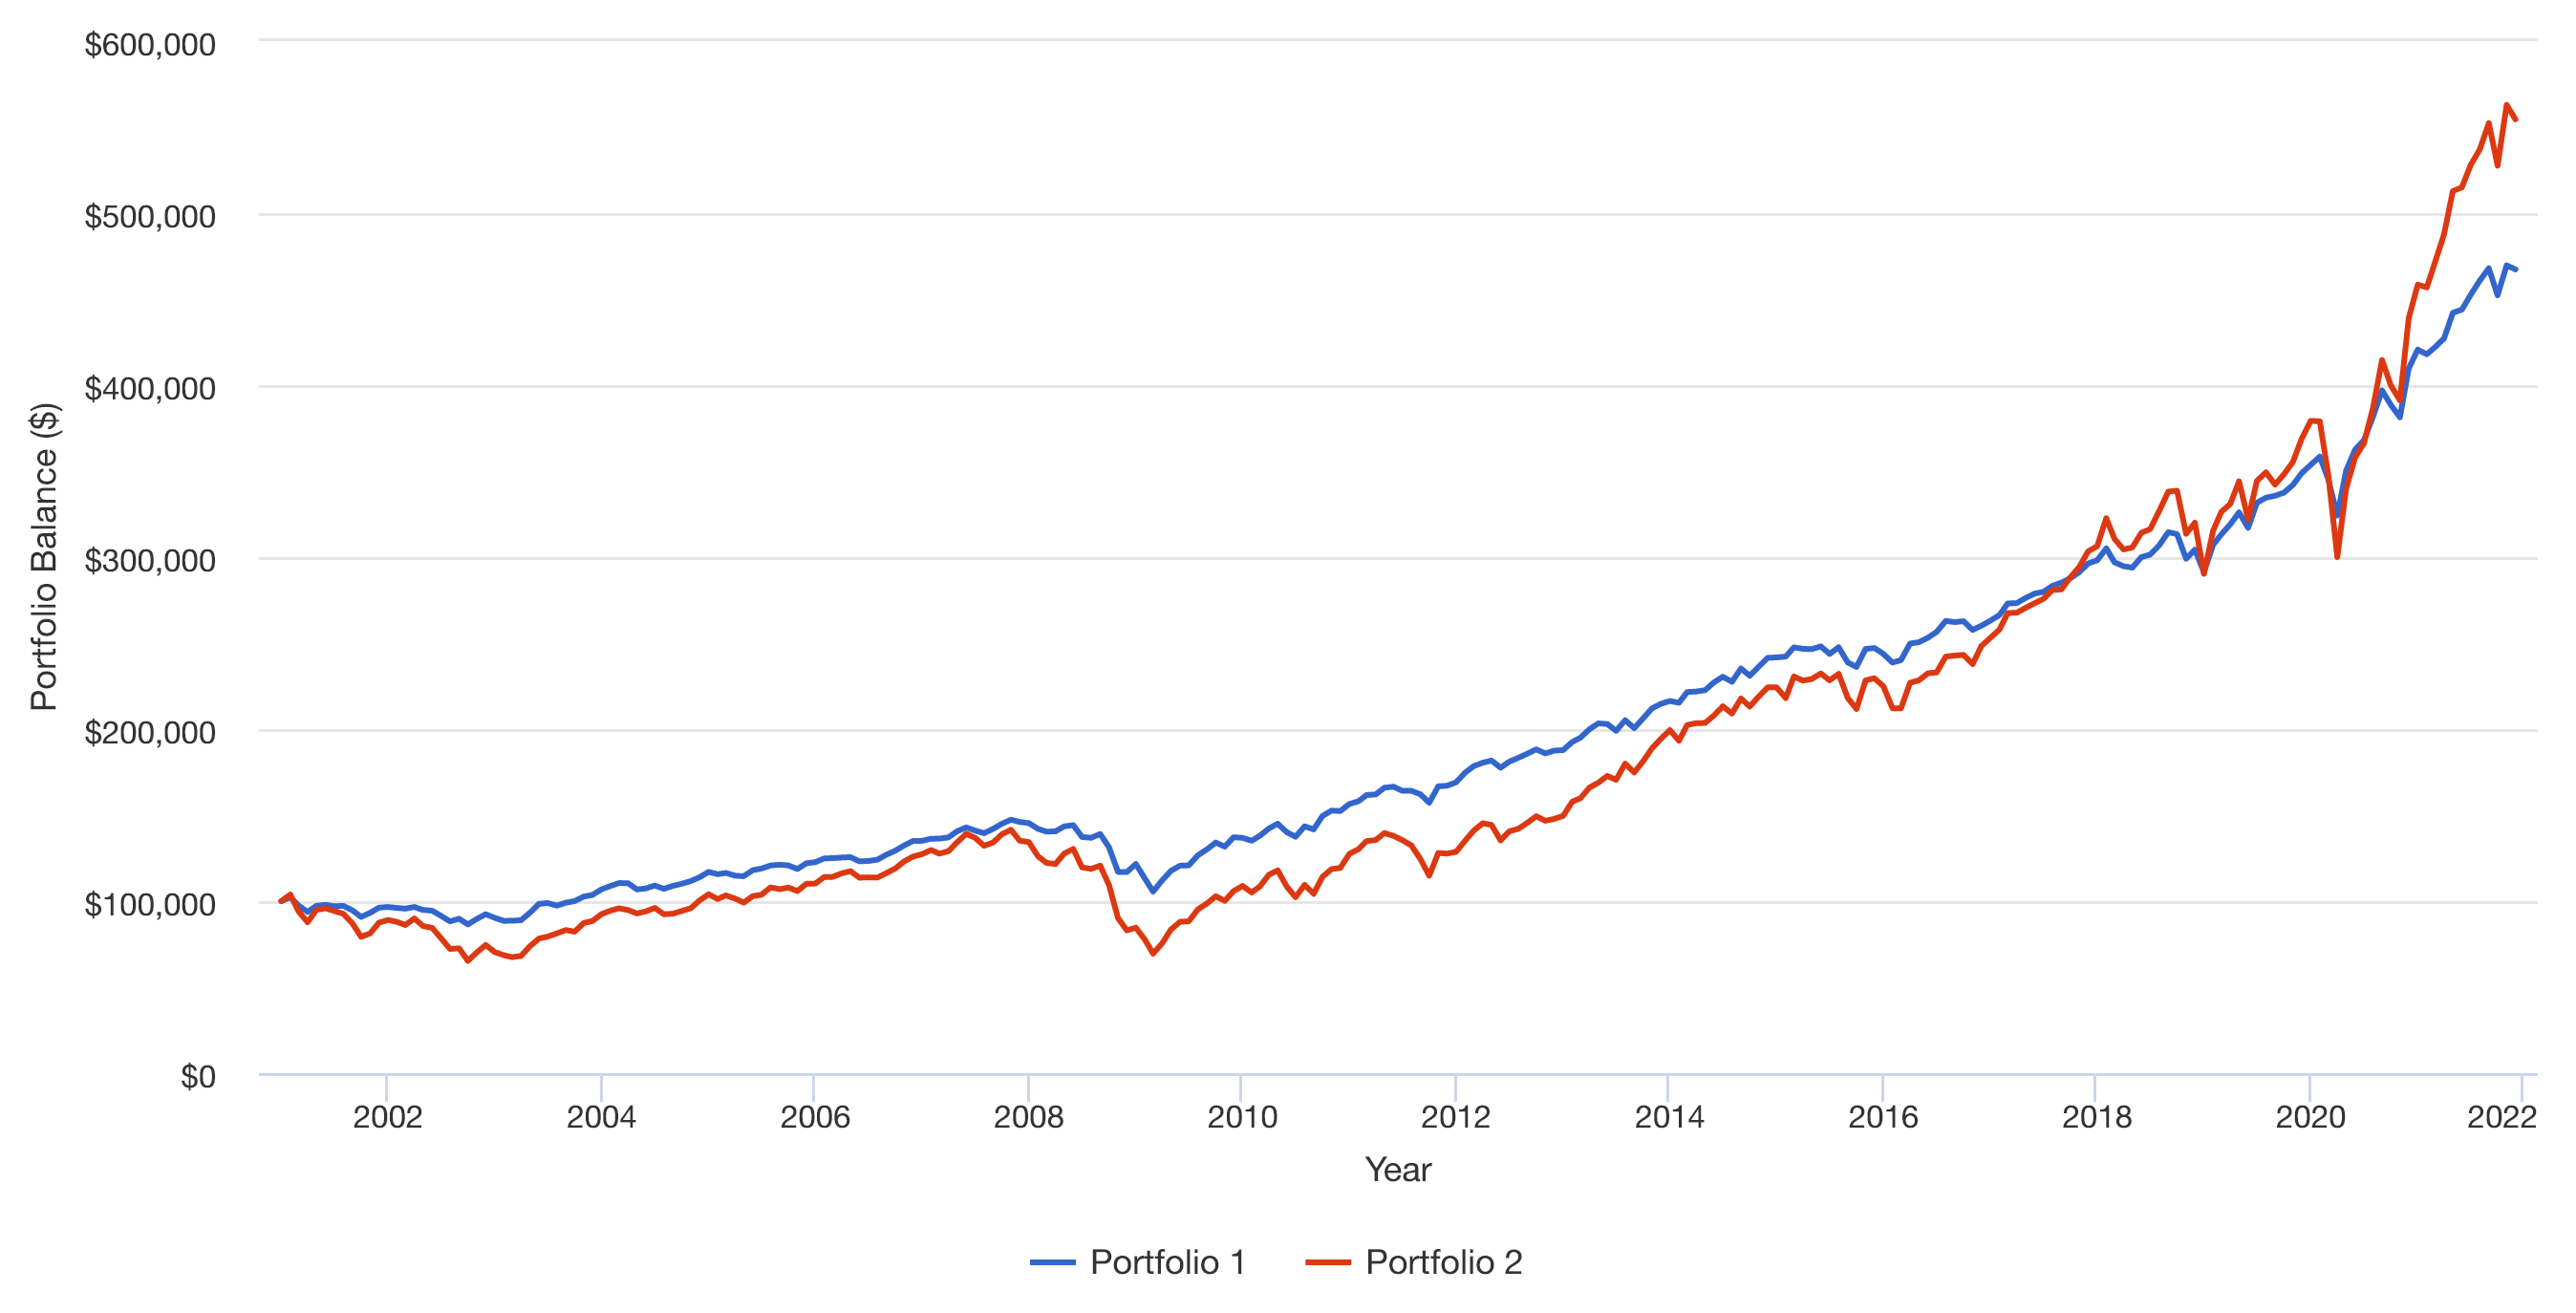
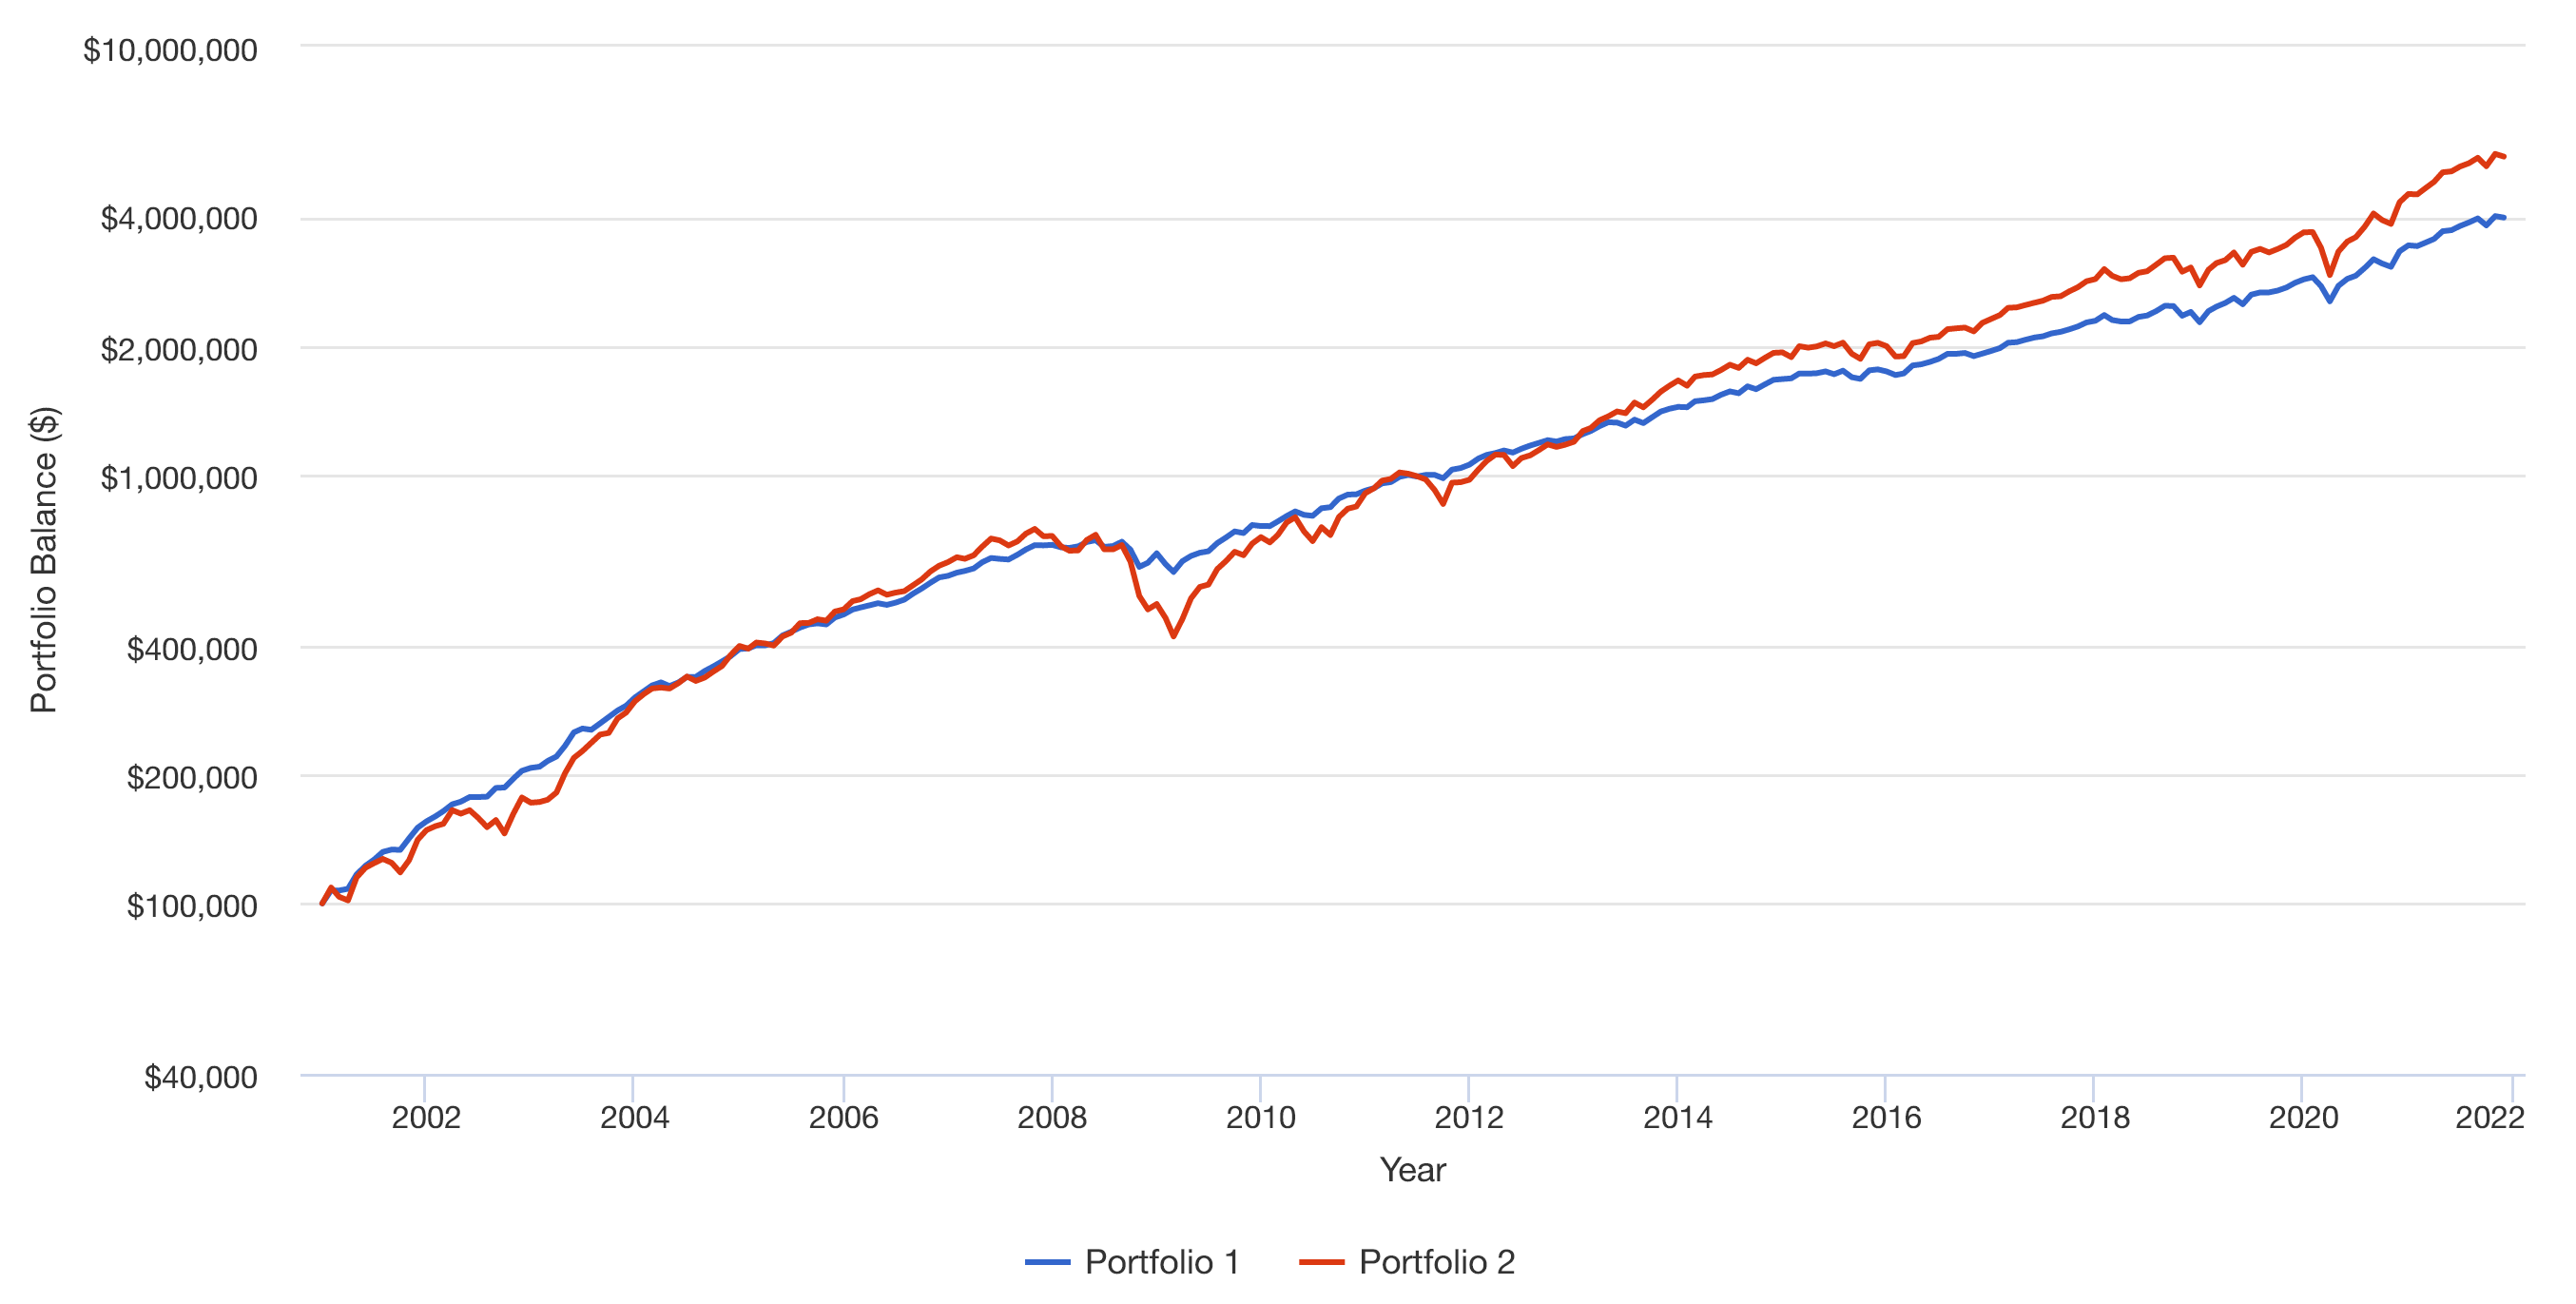
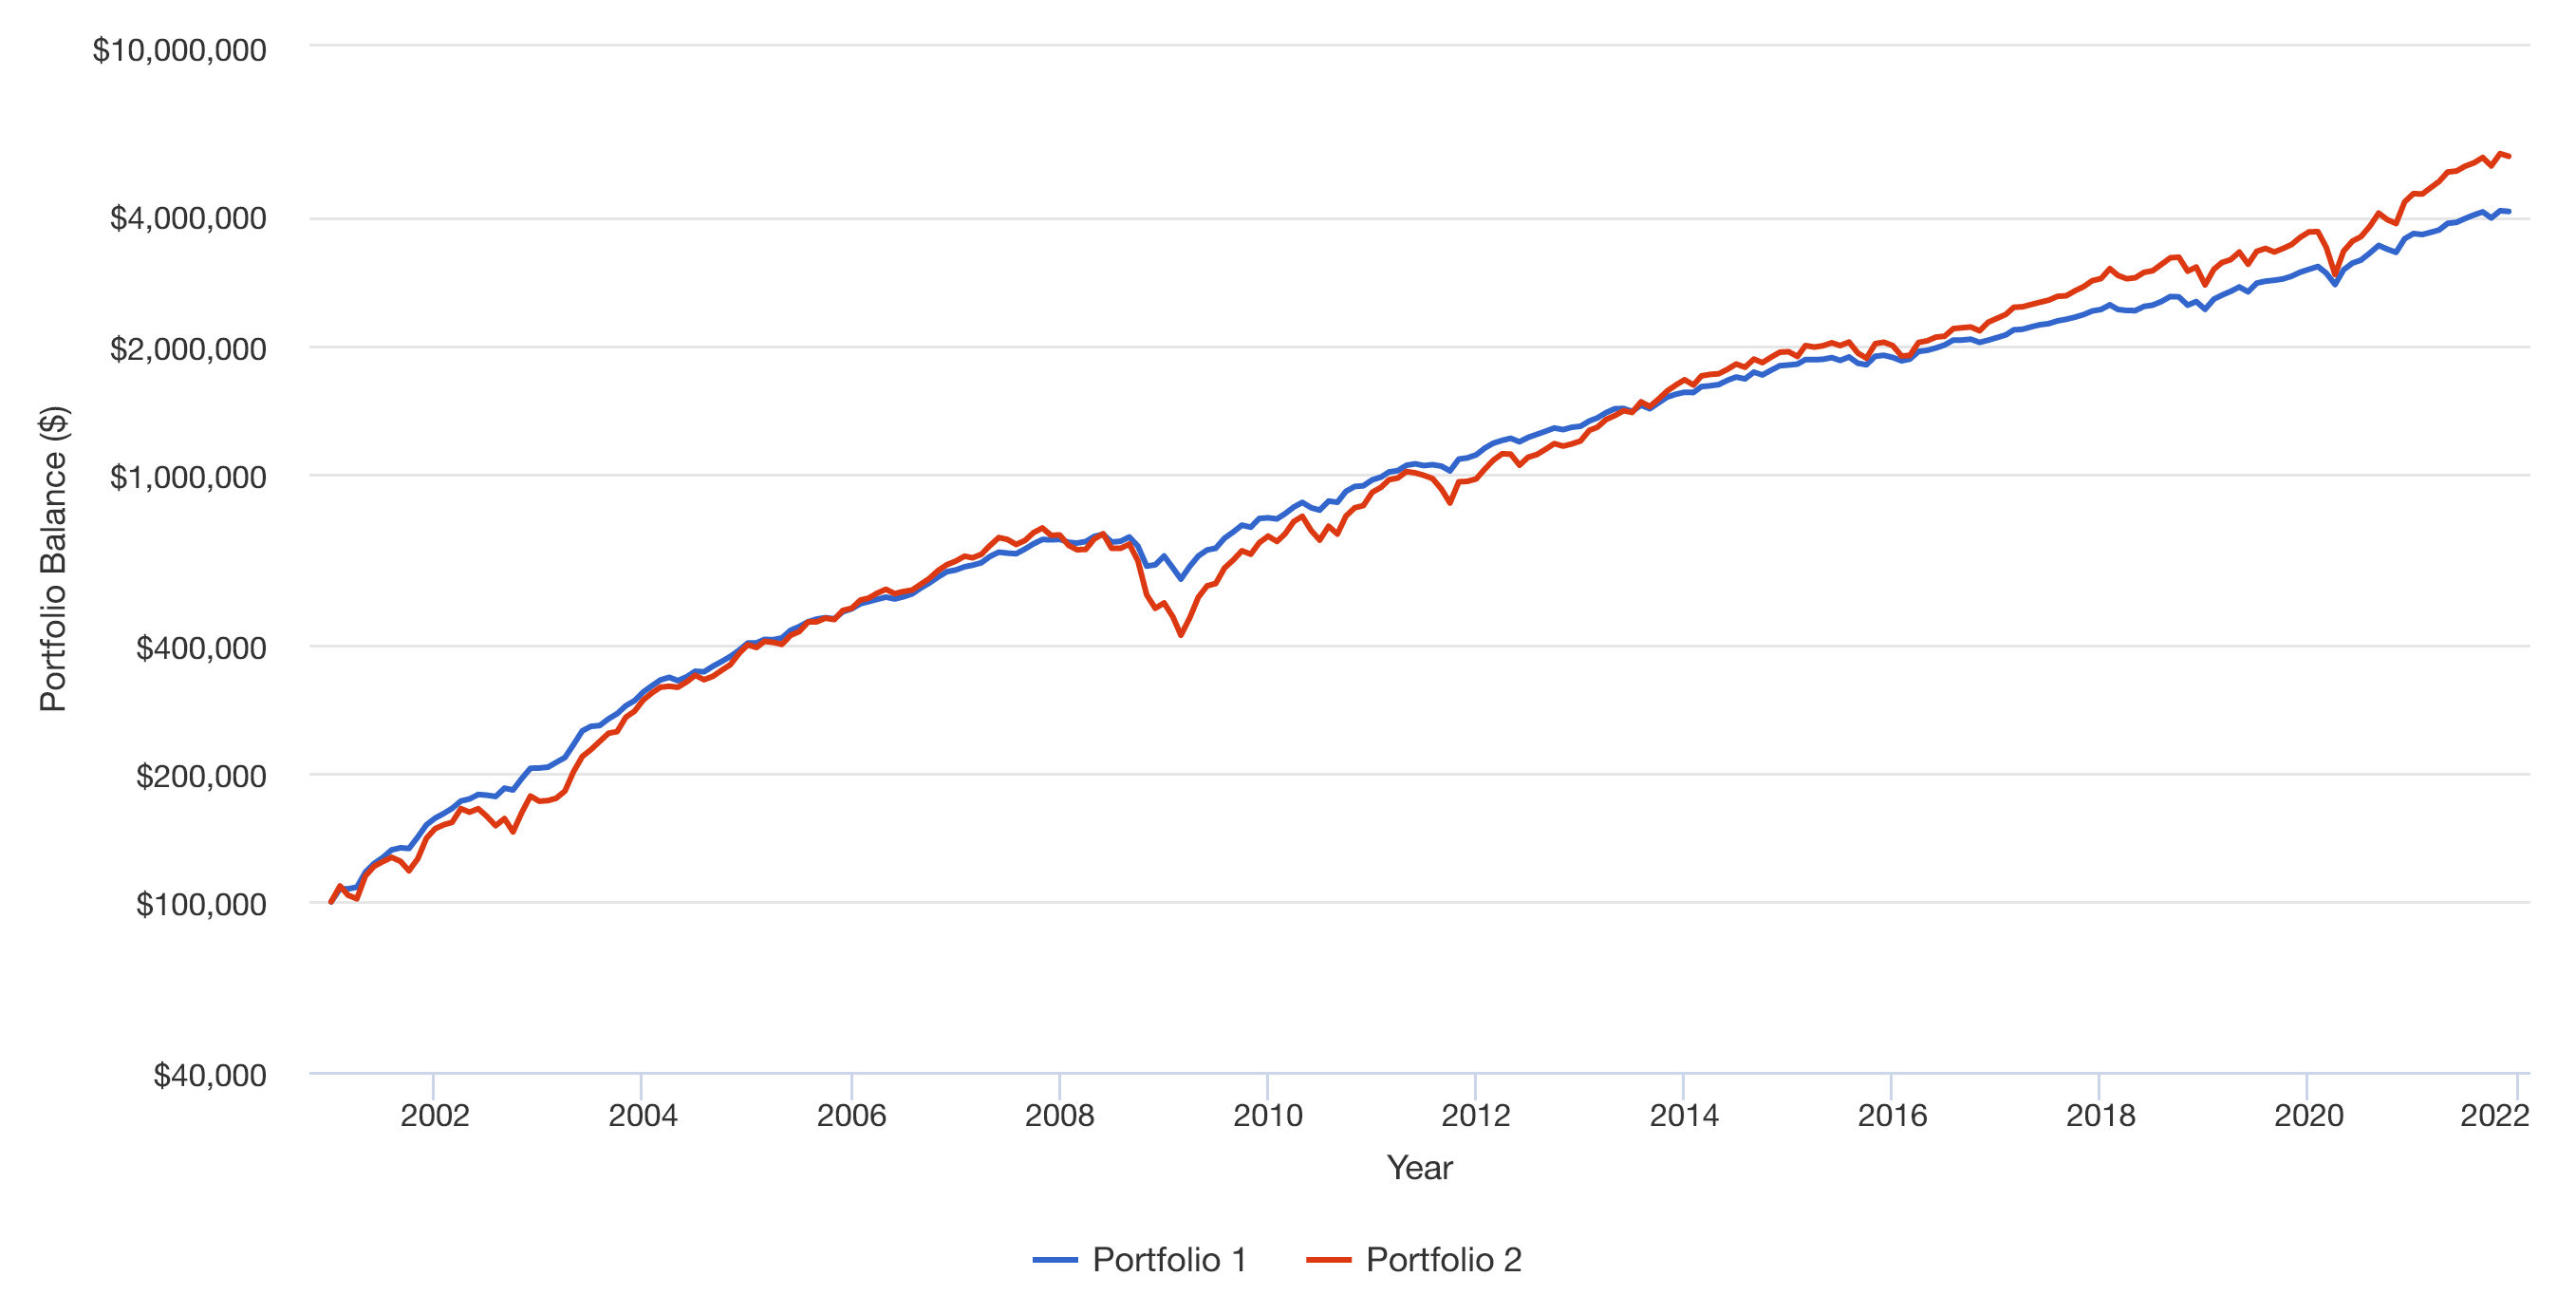
Back to your question #1 and #2. In the following charts:
- Portfolio 1 represents 60% S&P 500 and 40% 10-year Treasury
- Portfolio 2 100% S&P 500
Asseume Reinvested Dividend/Interest.
$100k Lump Sum with No Rebalancing = False
$100k Lump Sum with Quarterly Rebalancing = False
$100k Lump Sum and $5k Monthly Dollar Cost Averaging with No Rebalancing = False
$100k Lump Sum and $5k Monthly Dollar Cost Averaging with Quarterly Rebalancing = False
I would not spend a minute of my life watching such videos.

