You say: "I have noticed on the news that the stock market is taking a significant hit due to the United States' new tariff policy with China." and then you follow up saying: "...stock trends are down...".
Maybe you should look at the charts below:
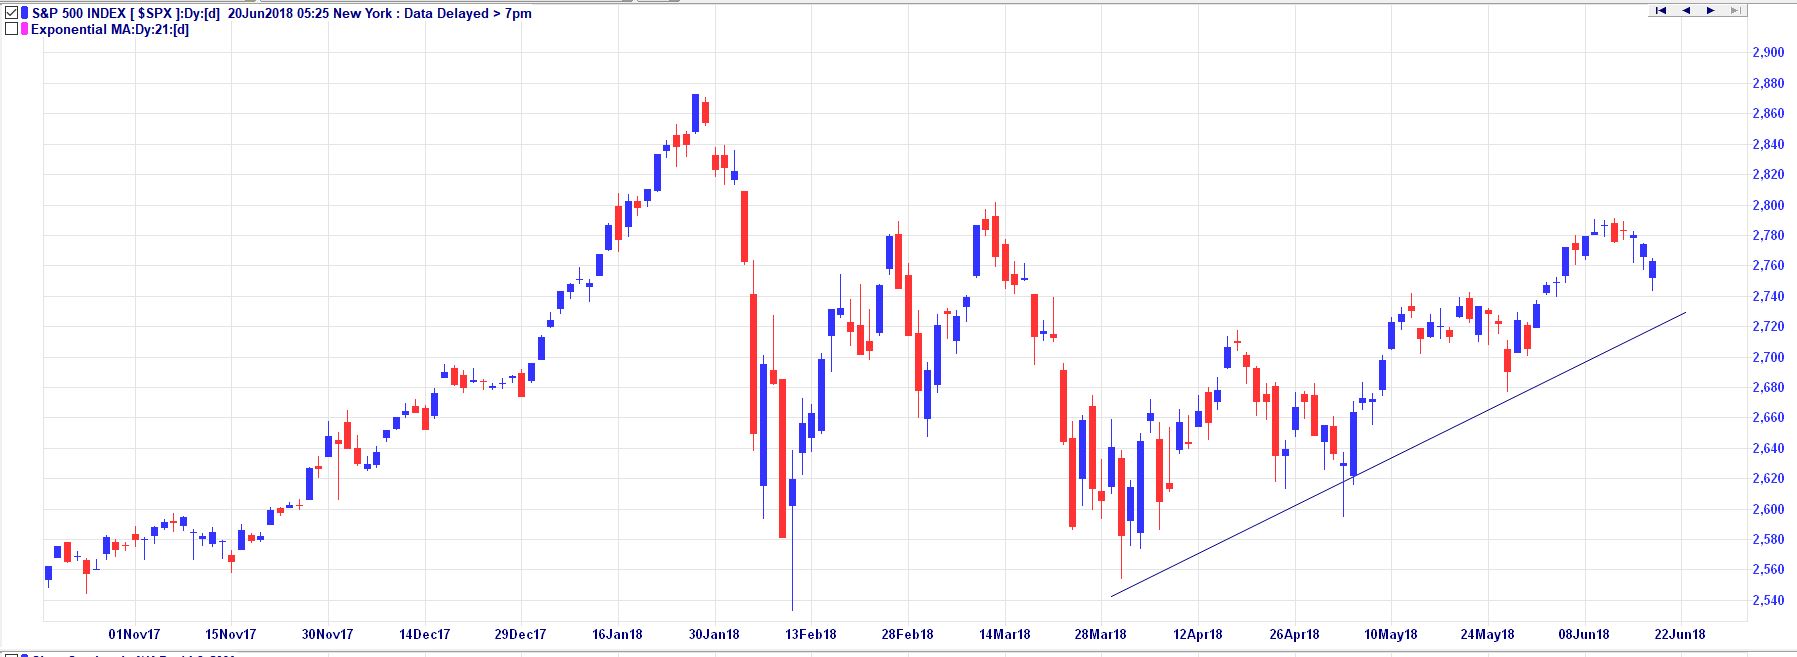
The daily chart of the S&P 500 show that prices have just started a new uptrend from April 2018, and have just fallen slightly from their recent highs.
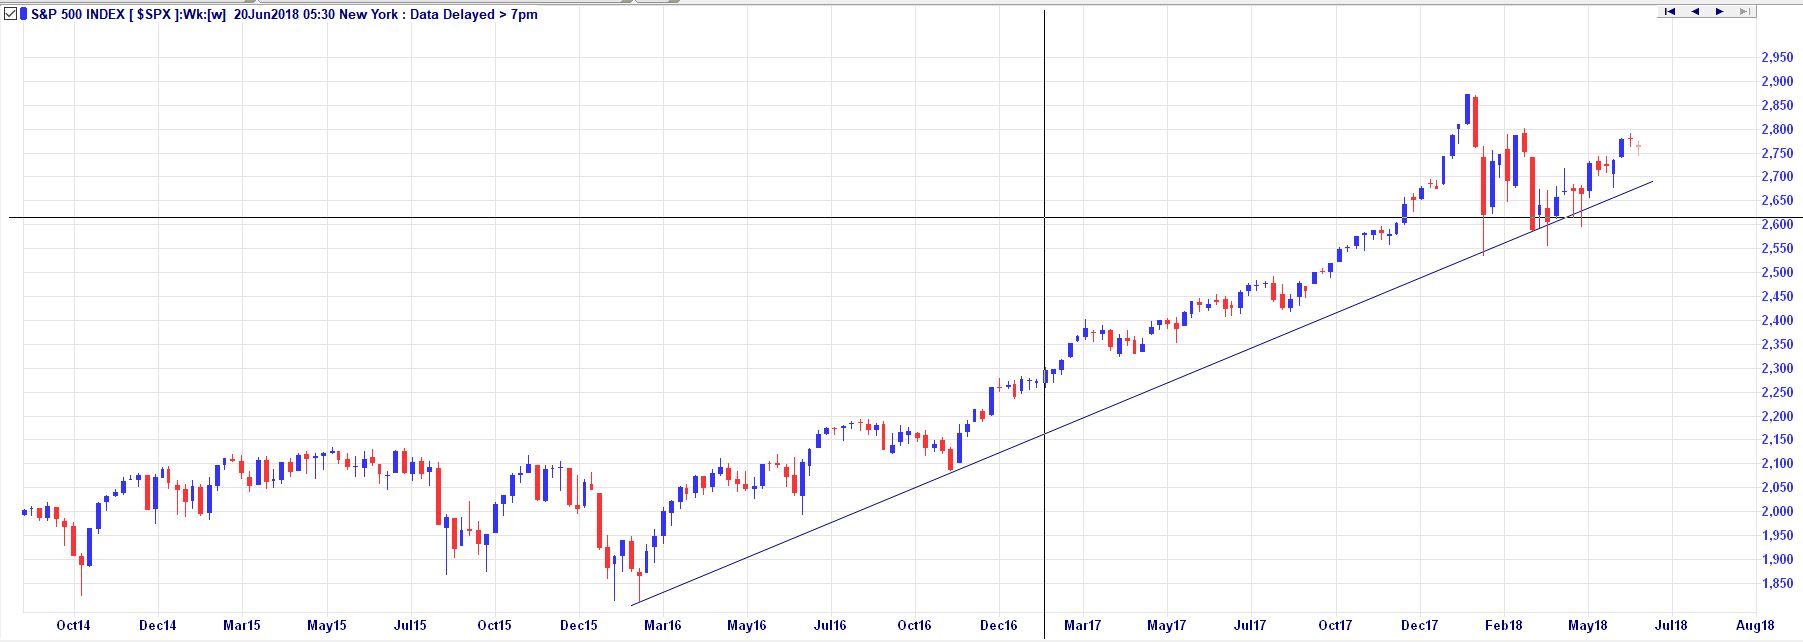
The weekly chart of the S&P 500 shows an uptrend from early 2016, which almost ended in early 2018, but has not yet developed into a downtrend, rather it is somewhat going sideways. It could recover (as the daily chart suggests) and develop into a new uptrend if prices go above 2802, or if prices fall below 2553 it could develop into a downtrend.
You would generally look at daily charts for a medium term timeframe of months to a year or two, and at a weekly chart for longer term timeframes of years to decades.
So don't believe everything you hear in the news, it usually does not represent what is actually happening in the markets.
If you were looking to get into the market for the long term, say 5 years plus, I would wait. If prices move above 2802, then jump in as this is confirmation of a new uptrend commencing. If prices fall below 2553, keep waiting and don't buy, as this is confirmation of a new downtrend starting, and you shouldn't buy until the downtrend is over.
In my view, based on the daily chart uptrend and how close the current price is to 2802 (only 40 points away as of the 19th June 2018), I would be expecting a new uptrend to commence in the next week or two.


