I am strongly skeptical of this.
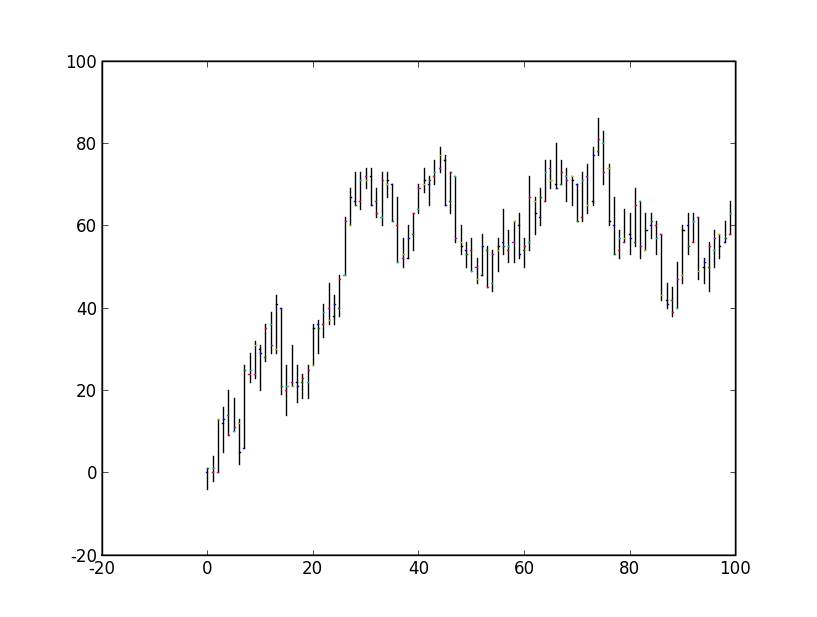
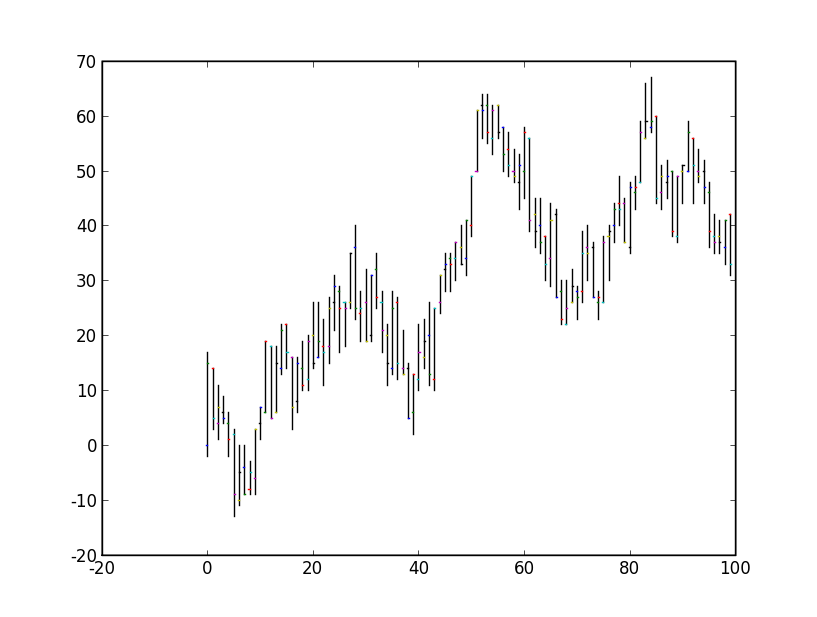
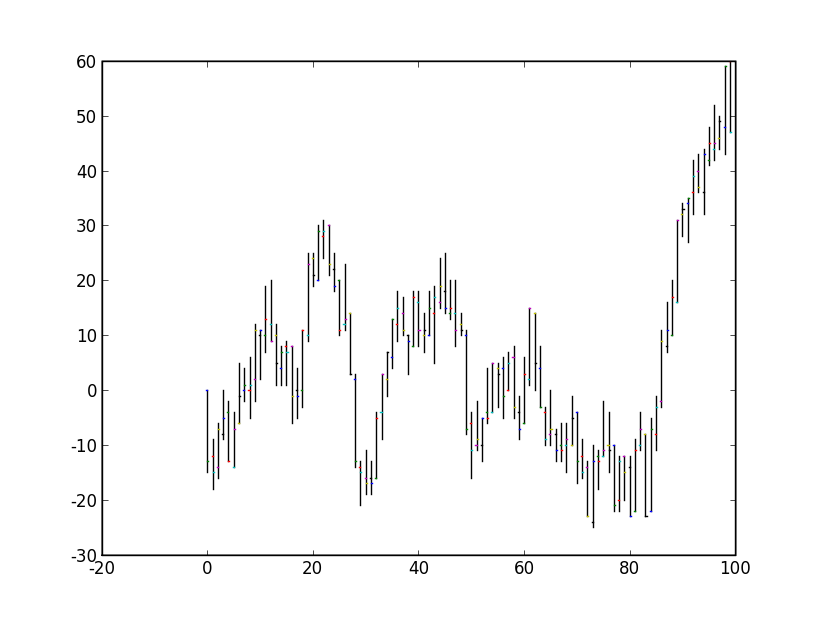
In fact, after reading your question, I did the following: I wrote a little program in python that "simulates" a stock by flipping a coin. Each time the coin comes up heads, the stock's value grows by 1. Each time the coin comes up tails, the stock's value drops by 1.
I then group, say, 50 of these steps into a "day", and for each day I look at opening, closing, maximum and minimum. This is then graphed in a candlestick chart.
Funny enough, those things look exactly like the charts analysts look at. Here are a few examples:


If you want to be a troll, show these to a technical analyst and ask them which of these stocks you should sell short and which of them you should buy.
You can try this at home, I posted the code here and it only needs Python with a few extra packages (Numpy and Pylab, should both be in the SciPy package).
In reply to a comment from JoeTaxpayer, let me add some more theory to this.
My code actually performs a one-dimensional random walk. Now Joe in the comments says that an infinite number of flips should approach the zero line, but that is not exactly correct. In fact, there is a high chance to end up far from the zero line, because the expected distance from the start for a random walk with N steps is sqrt(N).
What does indeed approach the zero line is if you took a bunch of these random walks and then performed the average over those.
There is, however, one important aspect in which this random walk differs from the stock market: The random walk can go down as far as it likes, whereas a stock has a bottom below which it cannot fall. Reaching this bottom means the company is bankrupt and gets removed from the market. This means that the total stock market, which we might interpret as a sum of random walks, does indeed have a bias towards upwards movement, since I'm only averaging over those random walks that don't go below a certain threshold. But you can really only benefit from this effect by being broadly diversified.
