Fixed typo
Source Link
Flux
  • 17.2k
  • 10
  • 73
  • 133

Indices are used to assess how the total market is doing, but you can also trade them easily by buying and selling ETFs that track the S&P 500 ($SPY), Nasdaq ($QQQ), and Dow Jones Industrial Avg ($DJIA$DIA). Many people purely trade in the form of index because:

  • they're risk-averse,
  • desire slow but reliable growth, or
  • simply want to preserve already-established wealth.

Other people try to "beat the market" by exchanging individual stocks that they view as likely to outperform. Many newer blindly try whatever is trending, but the more experienced or professional traders focus on maximum possible drawdown and risk/reward ratios, using the index as a basis comparison.

Another way to describe the differences between index and individual stock picking is that by and large half of stocks are more volatile than the other half, and thus the index is a compromise between potential gain and risk or volatility. S&P 500 is the reference beta of 1, and hundreds of stocks have a higher beta w.r.t. S&P. Investors often don't like the uncertainty that comes with highly-volatile stocks, and prefer an index. Capital appreciation will be limited more, but risk goes down and the rapid swings of volatility decrease as well.


The same can be said about the Russell 3000 as an index, which is an interesting case study due to the fact that it collectively accounts for about 98% of available U.S. publicly-traded securities. It provides a massive cumulation of historical data on stocks. Assessment of the data leads to interesting conclusions. The vast majority of gains are attributable to a small minority of companies:

"For every Google (GOOG) or Apple (AAPL), there are hundreds of below average performers. Consider the following. For the period 1983-2008, the Russell 3000 (which represents about 98 percent of the investable market) returned almost 10 percent a year, producing a total return of 1,074 percent! During this period, about 40 percent of stocks had a negative return and about 20 percent of stocks lost nearly all of their value. Sixty-four percent of all the stocks underperformed the Russell 3000. Clearly a small number of stocks are responsible for a majority of the gains -- about 10 percent of stocks recorded huge wins in excess of 500 percent."[1]

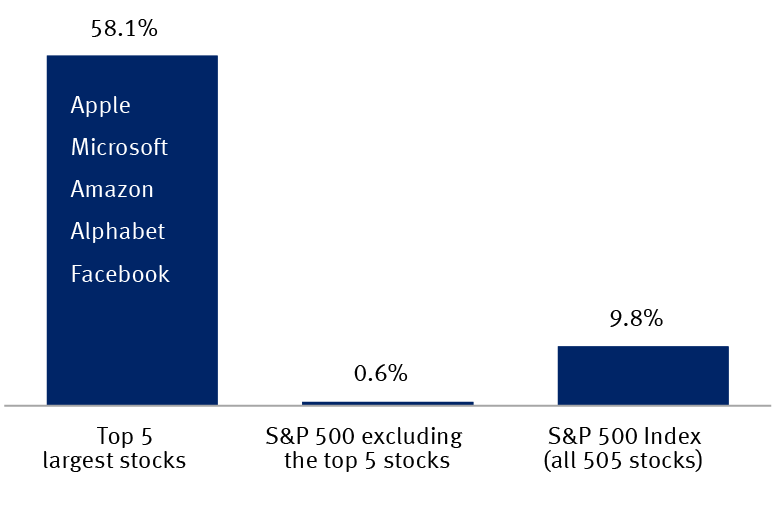
This is true for the S&P as well:[2]

enter image description here


If a trader chooses the right stocks then they'll end ahead. But if you pick out of a basket randomly, the probability of beating the market is low. This is why in-depth computation and risk management are seen as so imperative. Investors need to know what exactly they're buying in order to enhance their probability of success and optimize their portfolio.

Indices are used to assess how the total market is doing, but you can also trade them easily by buying and selling ETFs that track the S&P 500 ($SPY), Nasdaq ($QQQ), and Dow Jones Industrial Avg ($DJIA). Many people purely trade in the form of index because:

  • they're risk-averse,
  • desire slow but reliable growth, or
  • simply want to preserve already-established wealth.

Other people try to "beat the market" by exchanging individual stocks that they view as likely to outperform. Many newer blindly try whatever is trending, but the more experienced or professional traders focus on maximum possible drawdown and risk/reward ratios, using the index as a basis comparison.

Another way to describe the differences between index and individual stock picking is that by and large half of stocks are more volatile than the other half, and thus the index is a compromise between potential gain and risk or volatility. S&P 500 is the reference beta of 1, and hundreds of stocks have a higher beta w.r.t. S&P. Investors often don't like the uncertainty that comes with highly-volatile stocks, and prefer an index. Capital appreciation will be limited more, but risk goes down and the rapid swings of volatility decrease as well.


The same can be said about the Russell 3000 as an index, which is an interesting case study due to the fact that it collectively accounts for about 98% of available U.S. publicly-traded securities. It provides a massive cumulation of historical data on stocks. Assessment of the data leads to interesting conclusions. The vast majority of gains are attributable to a small minority of companies:

"For every Google (GOOG) or Apple (AAPL), there are hundreds of below average performers. Consider the following. For the period 1983-2008, the Russell 3000 (which represents about 98 percent of the investable market) returned almost 10 percent a year, producing a total return of 1,074 percent! During this period, about 40 percent of stocks had a negative return and about 20 percent of stocks lost nearly all of their value. Sixty-four percent of all the stocks underperformed the Russell 3000. Clearly a small number of stocks are responsible for a majority of the gains -- about 10 percent of stocks recorded huge wins in excess of 500 percent."[1]

This is true for the S&P as well:[2]

enter image description here


If a trader chooses the right stocks then they'll end ahead. But if you pick out of a basket randomly, the probability of beating the market is low. This is why in-depth computation and risk management are seen as so imperative. Investors need to know what exactly they're buying in order to enhance their probability of success and optimize their portfolio.

Indices are used to assess how the total market is doing, but you can also trade them easily by buying and selling ETFs that track the S&P 500 ($SPY), Nasdaq ($QQQ), and Dow Jones Industrial Avg ($DIA). Many people purely trade in the form of index because:

  • they're risk-averse,
  • desire slow but reliable growth, or
  • simply want to preserve already-established wealth.

Other people try to "beat the market" by exchanging individual stocks that they view as likely to outperform. Many newer blindly try whatever is trending, but the more experienced or professional traders focus on maximum possible drawdown and risk/reward ratios, using the index as a basis comparison.

Another way to describe the differences between index and individual stock picking is that by and large half of stocks are more volatile than the other half, and thus the index is a compromise between potential gain and risk or volatility. S&P 500 is the reference beta of 1, and hundreds of stocks have a higher beta w.r.t. S&P. Investors often don't like the uncertainty that comes with highly-volatile stocks, and prefer an index. Capital appreciation will be limited more, but risk goes down and the rapid swings of volatility decrease as well.


The same can be said about the Russell 3000 as an index, which is an interesting case study due to the fact that it collectively accounts for about 98% of available U.S. publicly-traded securities. It provides a massive cumulation of historical data on stocks. Assessment of the data leads to interesting conclusions. The vast majority of gains are attributable to a small minority of companies:

"For every Google (GOOG) or Apple (AAPL), there are hundreds of below average performers. Consider the following. For the period 1983-2008, the Russell 3000 (which represents about 98 percent of the investable market) returned almost 10 percent a year, producing a total return of 1,074 percent! During this period, about 40 percent of stocks had a negative return and about 20 percent of stocks lost nearly all of their value. Sixty-four percent of all the stocks underperformed the Russell 3000. Clearly a small number of stocks are responsible for a majority of the gains -- about 10 percent of stocks recorded huge wins in excess of 500 percent."[1]

This is true for the S&P as well:[2]

enter image description here


If a trader chooses the right stocks then they'll end ahead. But if you pick out of a basket randomly, the probability of beating the market is low. This is why in-depth computation and risk management are seen as so imperative. Investors need to know what exactly they're buying in order to enhance their probability of success and optimize their portfolio.

Source Link

Indices are used to assess how the total market is doing, but you can also trade them easily by buying and selling ETFs that track the S&P 500 ($SPY), Nasdaq ($QQQ), and Dow Jones Industrial Avg ($DJIA). Many people purely trade in the form of index because:

  • they're risk-averse,
  • desire slow but reliable growth, or
  • simply want to preserve already-established wealth.

Other people try to "beat the market" by exchanging individual stocks that they view as likely to outperform. Many newer blindly try whatever is trending, but the more experienced or professional traders focus on maximum possible drawdown and risk/reward ratios, using the index as a basis comparison.

Another way to describe the differences between index and individual stock picking is that by and large half of stocks are more volatile than the other half, and thus the index is a compromise between potential gain and risk or volatility. S&P 500 is the reference beta of 1, and hundreds of stocks have a higher beta w.r.t. S&P. Investors often don't like the uncertainty that comes with highly-volatile stocks, and prefer an index. Capital appreciation will be limited more, but risk goes down and the rapid swings of volatility decrease as well.


The same can be said about the Russell 3000 as an index, which is an interesting case study due to the fact that it collectively accounts for about 98% of available U.S. publicly-traded securities. It provides a massive cumulation of historical data on stocks. Assessment of the data leads to interesting conclusions. The vast majority of gains are attributable to a small minority of companies:

"For every Google (GOOG) or Apple (AAPL), there are hundreds of below average performers. Consider the following. For the period 1983-2008, the Russell 3000 (which represents about 98 percent of the investable market) returned almost 10 percent a year, producing a total return of 1,074 percent! During this period, about 40 percent of stocks had a negative return and about 20 percent of stocks lost nearly all of their value. Sixty-four percent of all the stocks underperformed the Russell 3000. Clearly a small number of stocks are responsible for a majority of the gains -- about 10 percent of stocks recorded huge wins in excess of 500 percent."[1]

This is true for the S&P as well:[2]

enter image description here


If a trader chooses the right stocks then they'll end ahead. But if you pick out of a basket randomly, the probability of beating the market is low. This is why in-depth computation and risk management are seen as so imperative. Investors need to know what exactly they're buying in order to enhance their probability of success and optimize their portfolio.