5

My question is based on a particular segment of a show on YouTube. Segment starts at 19:42 (linked) and ends around the 25-ish minute mark. (It's the Money Guy Show if you're curious.)

I was surprised to see a 60/40 stock/bond portfolio return more than a pure stock portfolio over the last 20 years. I figured one asset class would outperform the other over any given period of time, and that would be the one you would want to be in. But then I realized I forgot about rebalancing.

In my mental model, rebalancing essentially causes a particular portfolio to do a bit of buying low (moving from bonds to stocks as stock prices go down) and selling high (moving from stocks to bonds as stock prices go up). My questions are:

  1. Is my mental model an accurate way to understand why the 60/40 outperformed pure stock?
  2. The video segment talks about a fixed amount invested once at the beginning of the time period, with no additions over that period. Would this 60/40 outperformance still hold if someone started with $0 invested initially and invested a fix amount every month?
1
  • I did not watch the vid yet so I am only writing a comment. Any comparison that assumes a static portfolio size is unrealistic (most people have to earn their invested money yet) and it is very sensitive to the chosen time frame. The first decade of the 2000s was pretty bad on the stock market while interest rates were reasonable. And with falling interest rates since the financial crisis we get rising bond prices which gives bonds another advantage. This is not likely to be a good projection of the next 20 years or even 2010-2030
    – Manziel
    Commented Dec 2, 2021 at 9:46

6 Answers 6

12

Final Edit: End Value of 60/40(10-Year Treasury) is worse than S&P 500.

Instead of blindly deriving the Bonds Fund price from Yield to Maturity, this time using the oldest available proxy to 10-Year Treasury Index (i.e. Lehman/Barclays/Bloomberg) which are the following Mutual Funds in 6:4 Ratio:

  • Vanguard Intermediate-Term Treasury Fund Investor Shares (VFITX), duration 5.2 years, inception 10/28/1991
  • Vanguard Long-Term Treasury Fund Investor Shares (VUSTX), duration 18.0 years, inception 05/19/1986

and:

  • Vanguard Total Stock Market Index Fund Investor Shares (VTSMX), inception 04/27/1992

In the following charts:

  • Portfolio 1 represents 60% S&P 500 (VTSMX), 24% VFITX + 16% VUSTX (10-year Treasury)
  • Portfolio 2 100% S&P 500 (VTSMX)

Assume Montly Rebalancing because that is how balanced funds and the index works.

$100k Lump Sum with Monthly Rebalancing = False
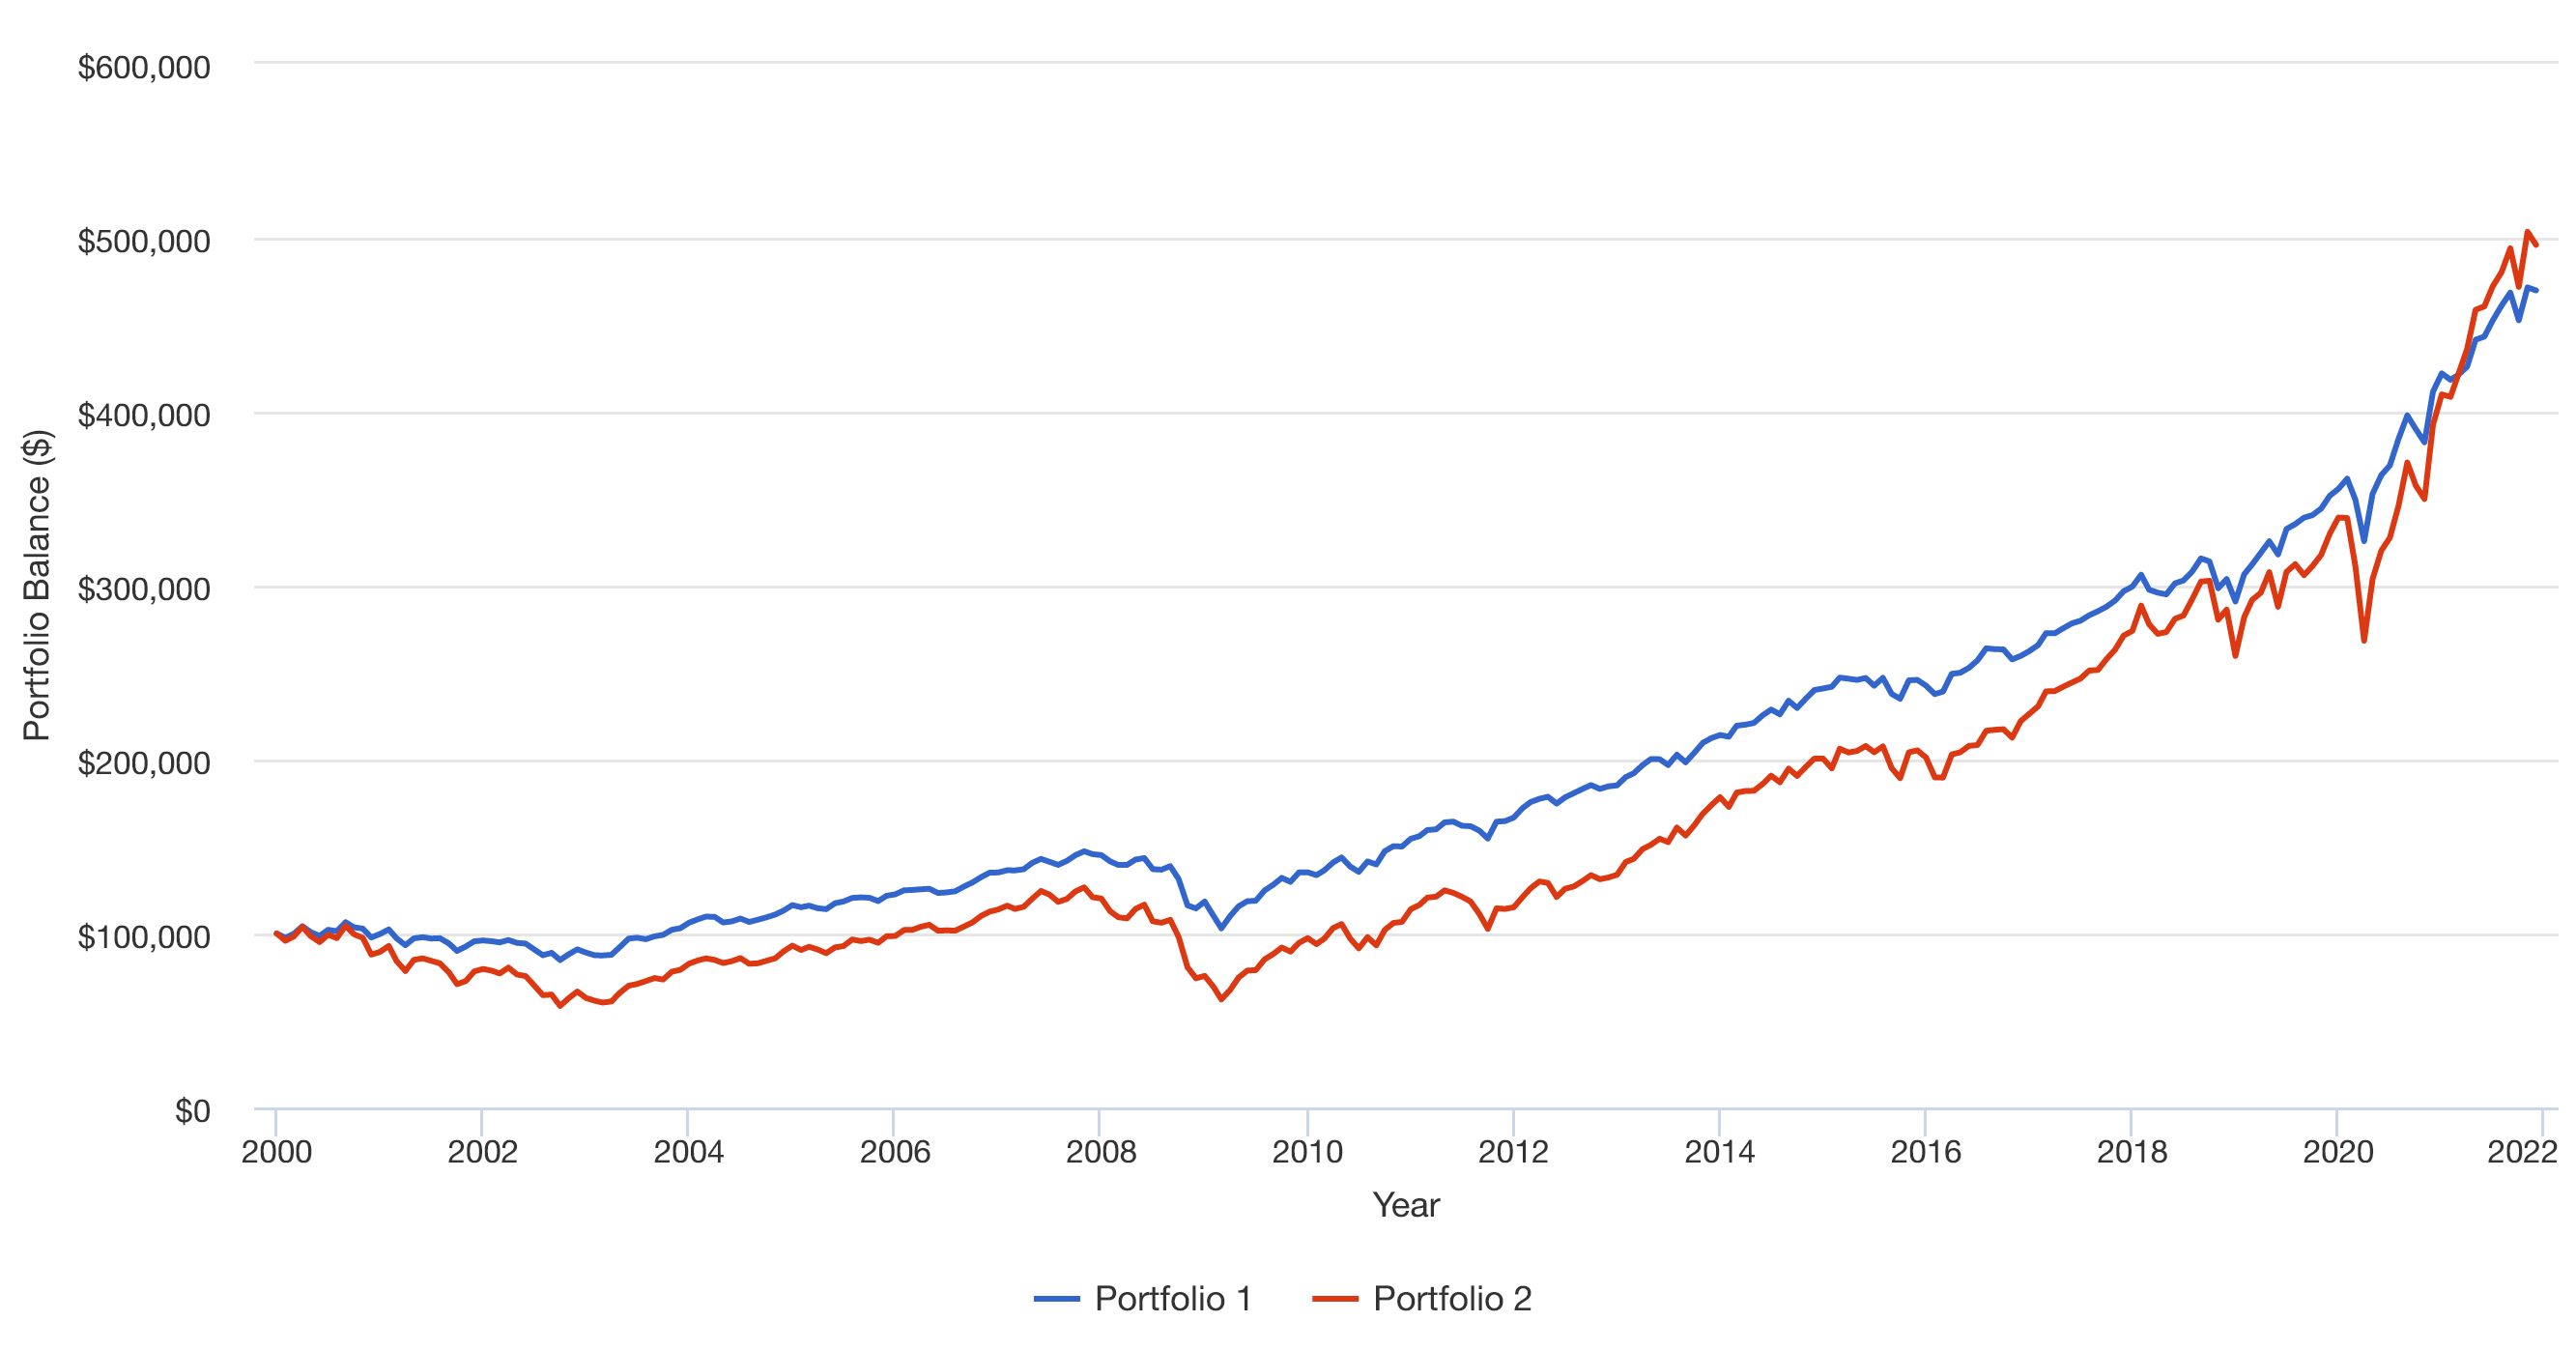
G

$100k Lump Sum and $5k Monthly Dollar Cost Averaging with Monthly Rebalancing = False

G2


Edit: After discussing with the author on their assumptions.

I hope we can settle the claim once and for all.

  • S&P 500 = Adjusted Close with Yahoo Finance
  • 10-year Treasury = Yield to Maturity from macrotrends.net, which I confirmed it to be extremely similar to treasury.gov
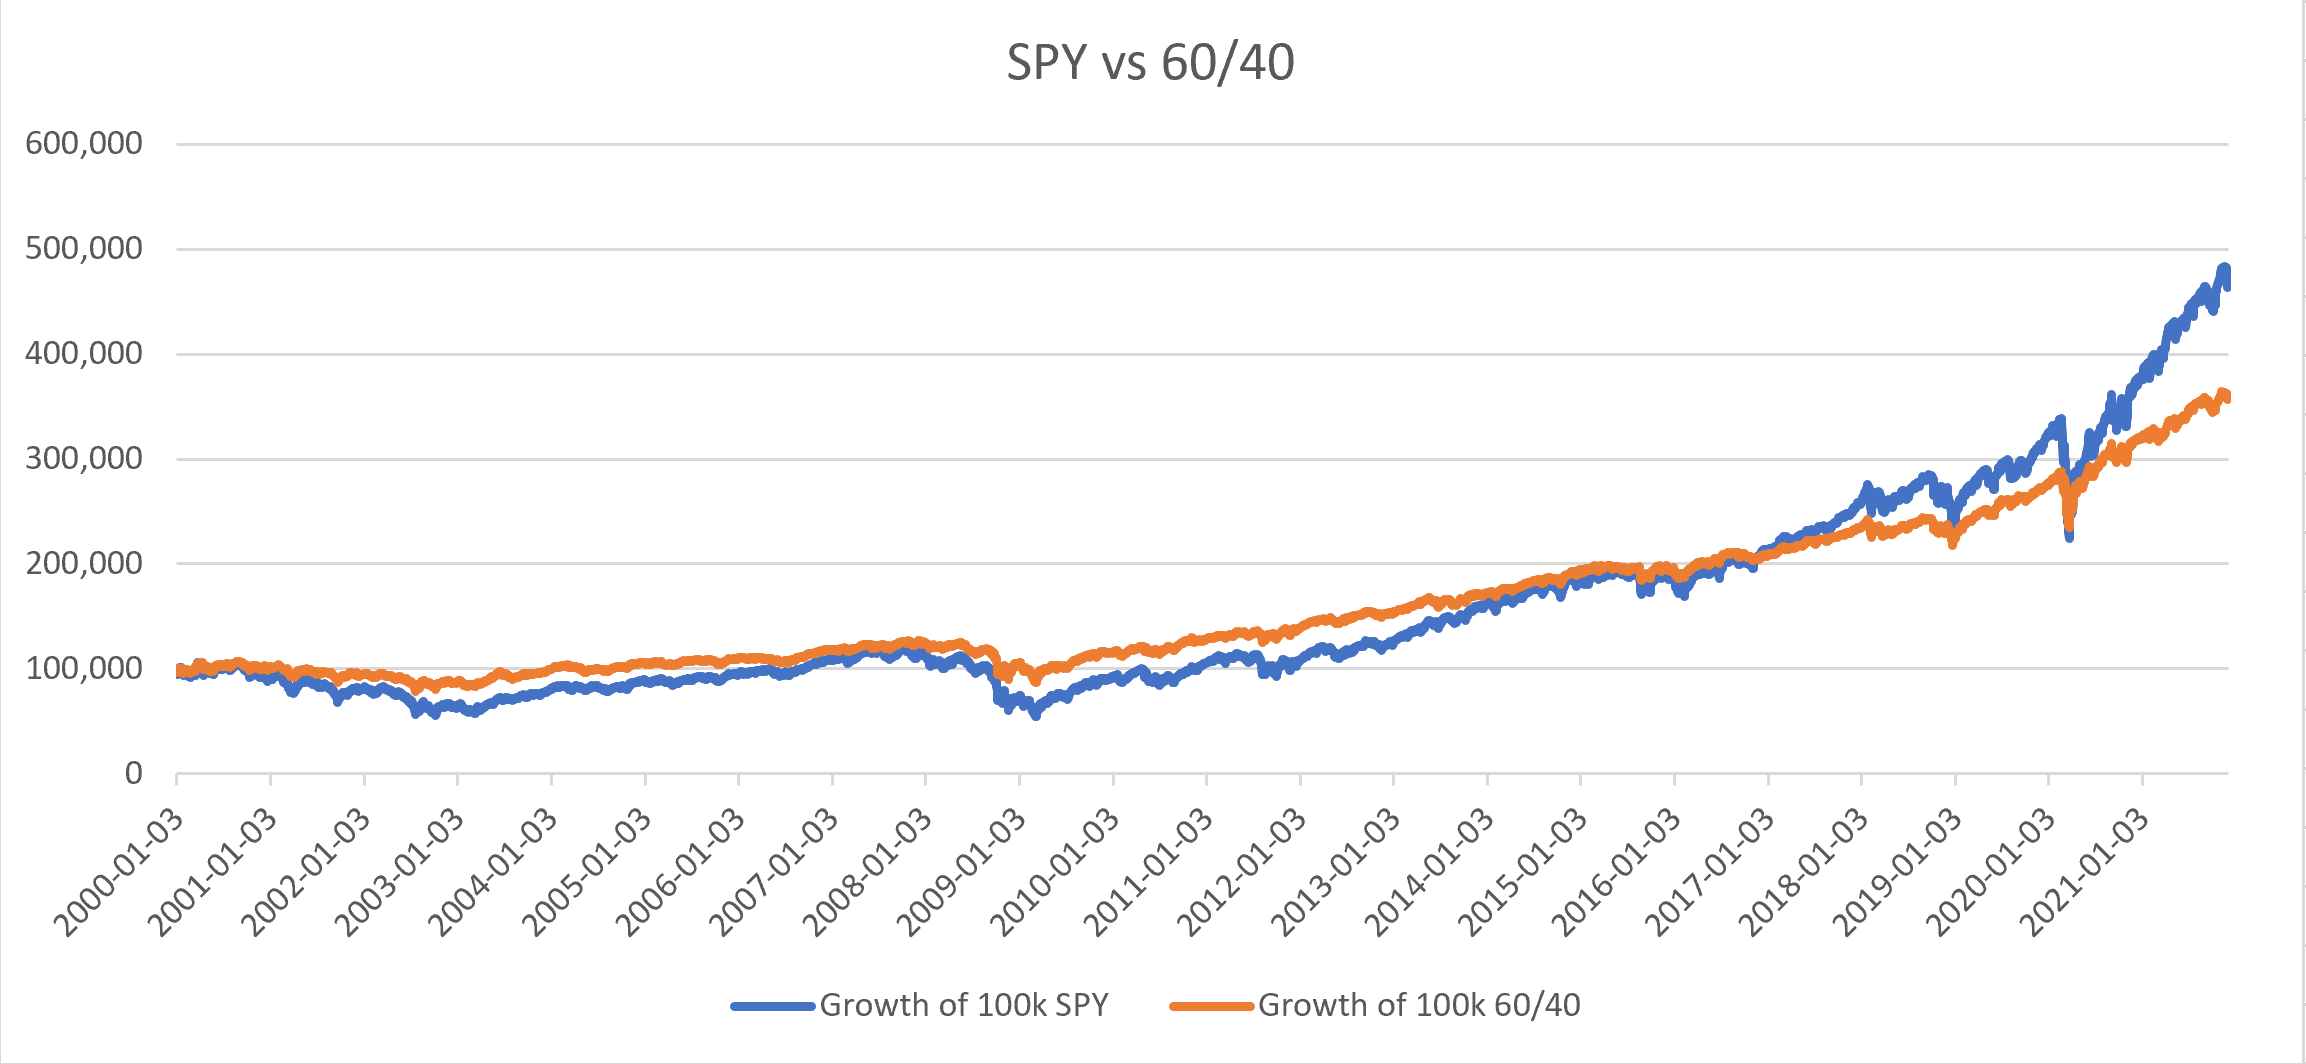
  • Start Date = 2000-01-03
  • End Date = 2021-12-01
  • Lump Sum $100,000 with no additional funds
  • Reinvested dividend
  • "Continous Rebalancing" = Assume Daily Rebalancing
  • No Bid/Ask Spread (theoretically TLH has 0.05% spread, which does add up daily.
  • No Capital Gains or Divividend Tax
  • Price of Bonds Fund = 100/((1+YTM/100)^10)
  • A very smart Bonds Fund manager is able to maintain constant maturity (theoretically a 10-year Bonds becomes 9.997-year Bonds after 1 day. )

Result: End-Value of 60/40 is worse than 100% S&P 500.
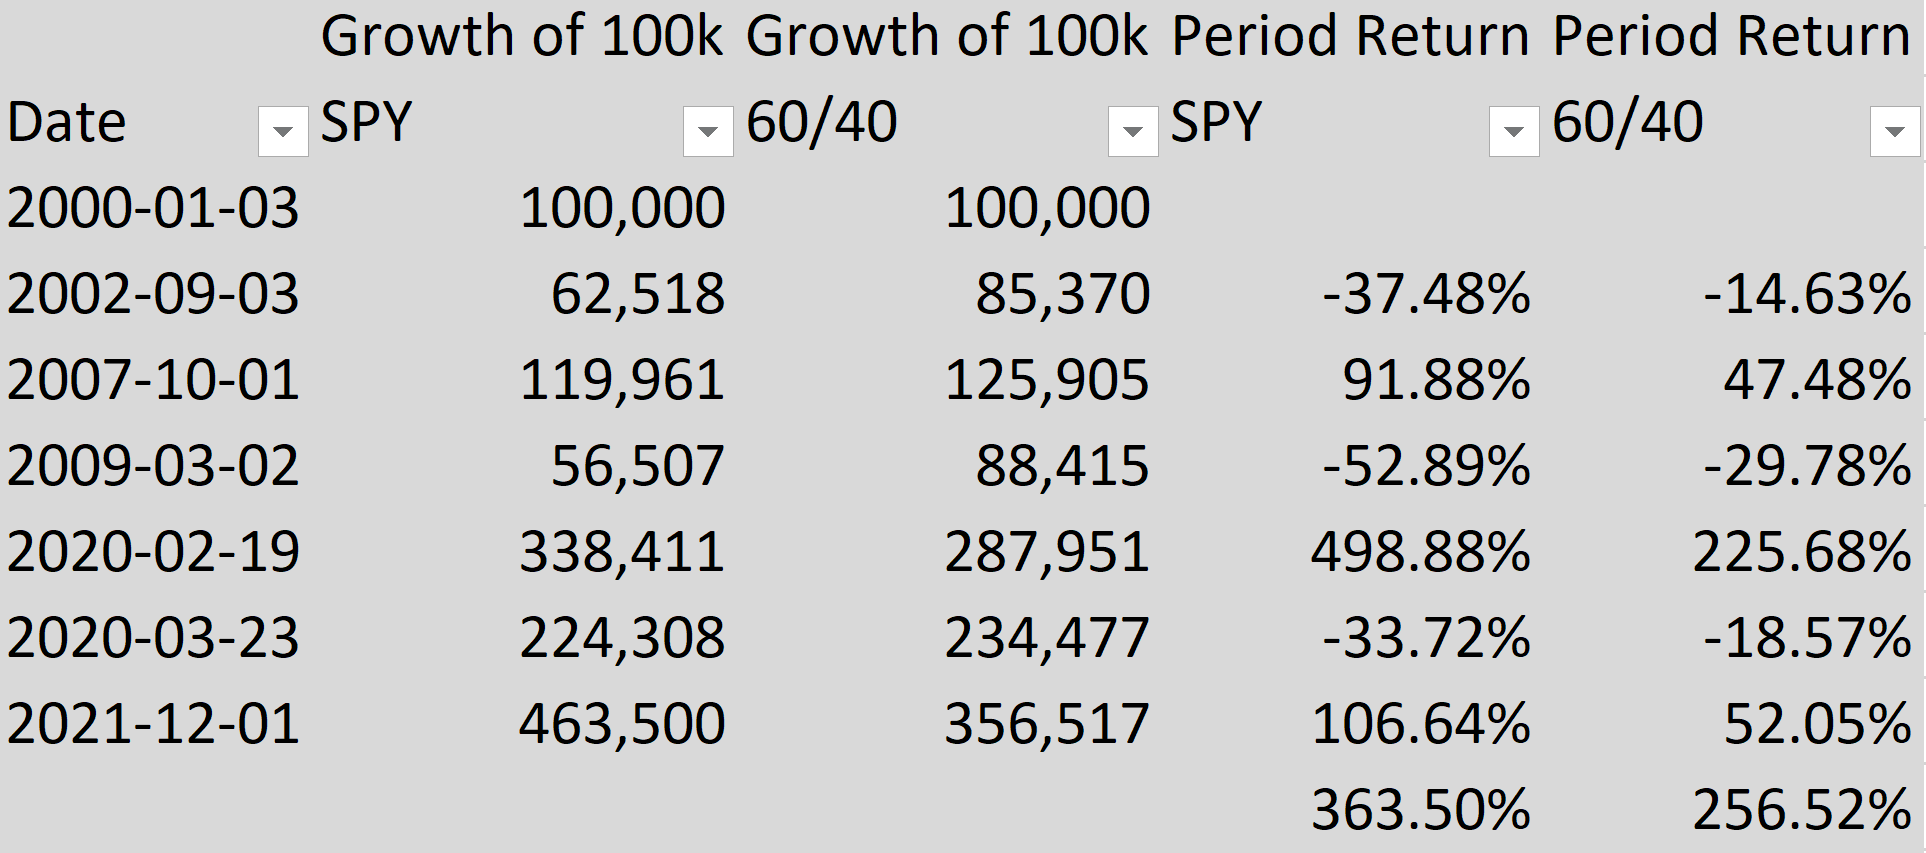
A

B

Raw Data, Formula, and Excel files here: https://www.mediafire.com/file/p34fe2y7td4dchx/6040_vs_SPY.xlsx/file


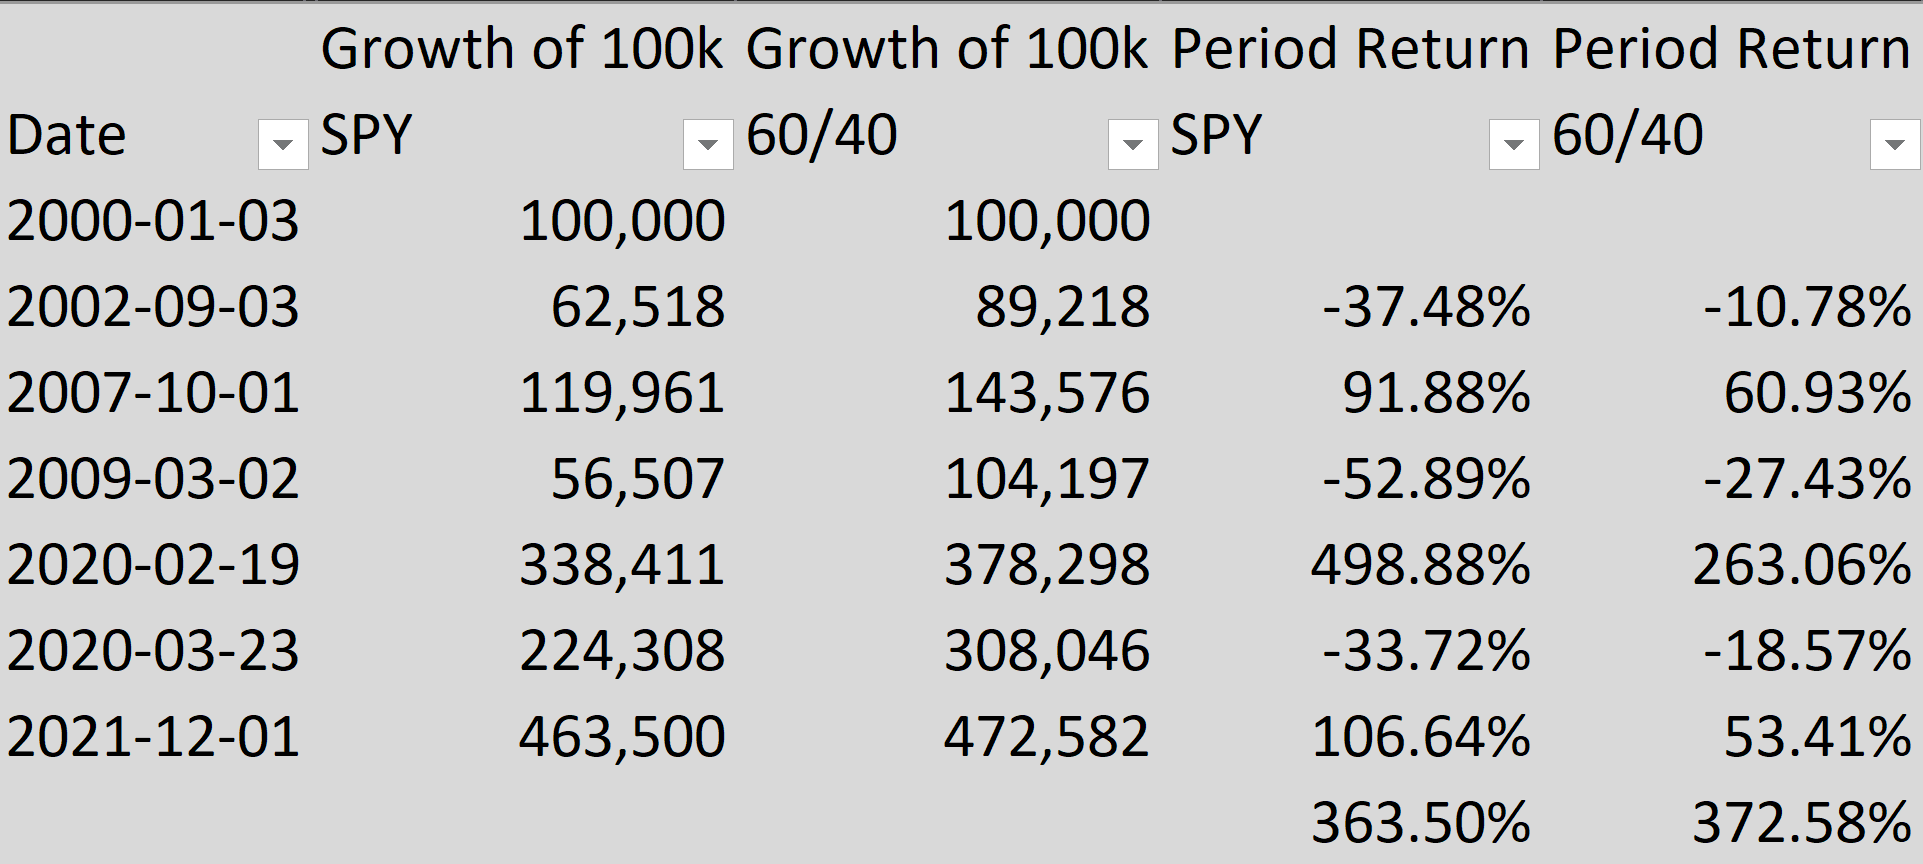
Edit 2: Using this calculation methodology (especially daily rebalancing) and including YTM that are realized (i.e. daily interest as income), the result is that 60/40 is slightly better than S&P 500.

However, practically this is debatable, especially when S&P 500 Total Return Index is much higher than Yahoo Finance Adjusted Return (372% vs 363%), and that Bonds market is inefficient with high bid/ask spread.

When using Passive Bonds Funds (Mutual Fund or ETF), I have yet to see that this calculation methodology is realistic. If you go to Morningstar and look for Active Balanced Funds since 2000, there will always be Outperforming Funds and Underperforming Funds. But if you look at those benchmarked at S&P 500/AGG, the outperformance with 100% S&P 500 didn't happen.

For example, using this calculation methodology, the total return from 2008 to 2021 is 225%, yet when using 60% SPY, 28% IEF, 12% TLH, it is 219%.

This further reinforces that deriving Bonds Price with only Yield to Maturity is an incorrect method, and that this discussion should have started with Total Bonds Market Index with monthly rebalancing, minus realistic tracking error, to begin with.

Still, it is not known how the author calculated 425.9% total return for 60/40 Portfolio.
C

D

Raw Data, Formula, and Excel files here: https://www.mediafire.com/file/n7unzo2kypjhk5n/6040_vs_SPY_with_Bonds_Interest.xlsx/file


If you look at the definition of "60/40 stock/bond portfolio" at 24:14 of the video, it says:

60/40 is 60% S&P 500 and 40% 10-year Treasury

This is the part where it is misleading. Treasury Bonds had a magnified great run in the past 20 years. The longer the duration of the Treasury, the higher return and lower volatility it brings.

This 60/40 is different from the Modern Portfolio Theory, where the "Market Portfolio" is 60% Total Stock Market and 40% Total Bonds Market (including Treasury, Corporate, Municipal, Junk, etc).

So instead of 40% BND ETF that Bogleheads recommended, the 10-year Treasury is simulated by IEF ETF and TLH ETF on a 7:3 Ratio.

They could have made it more misleading by using 20-25 years Treasury (i.e. TLT and EDV ETF).


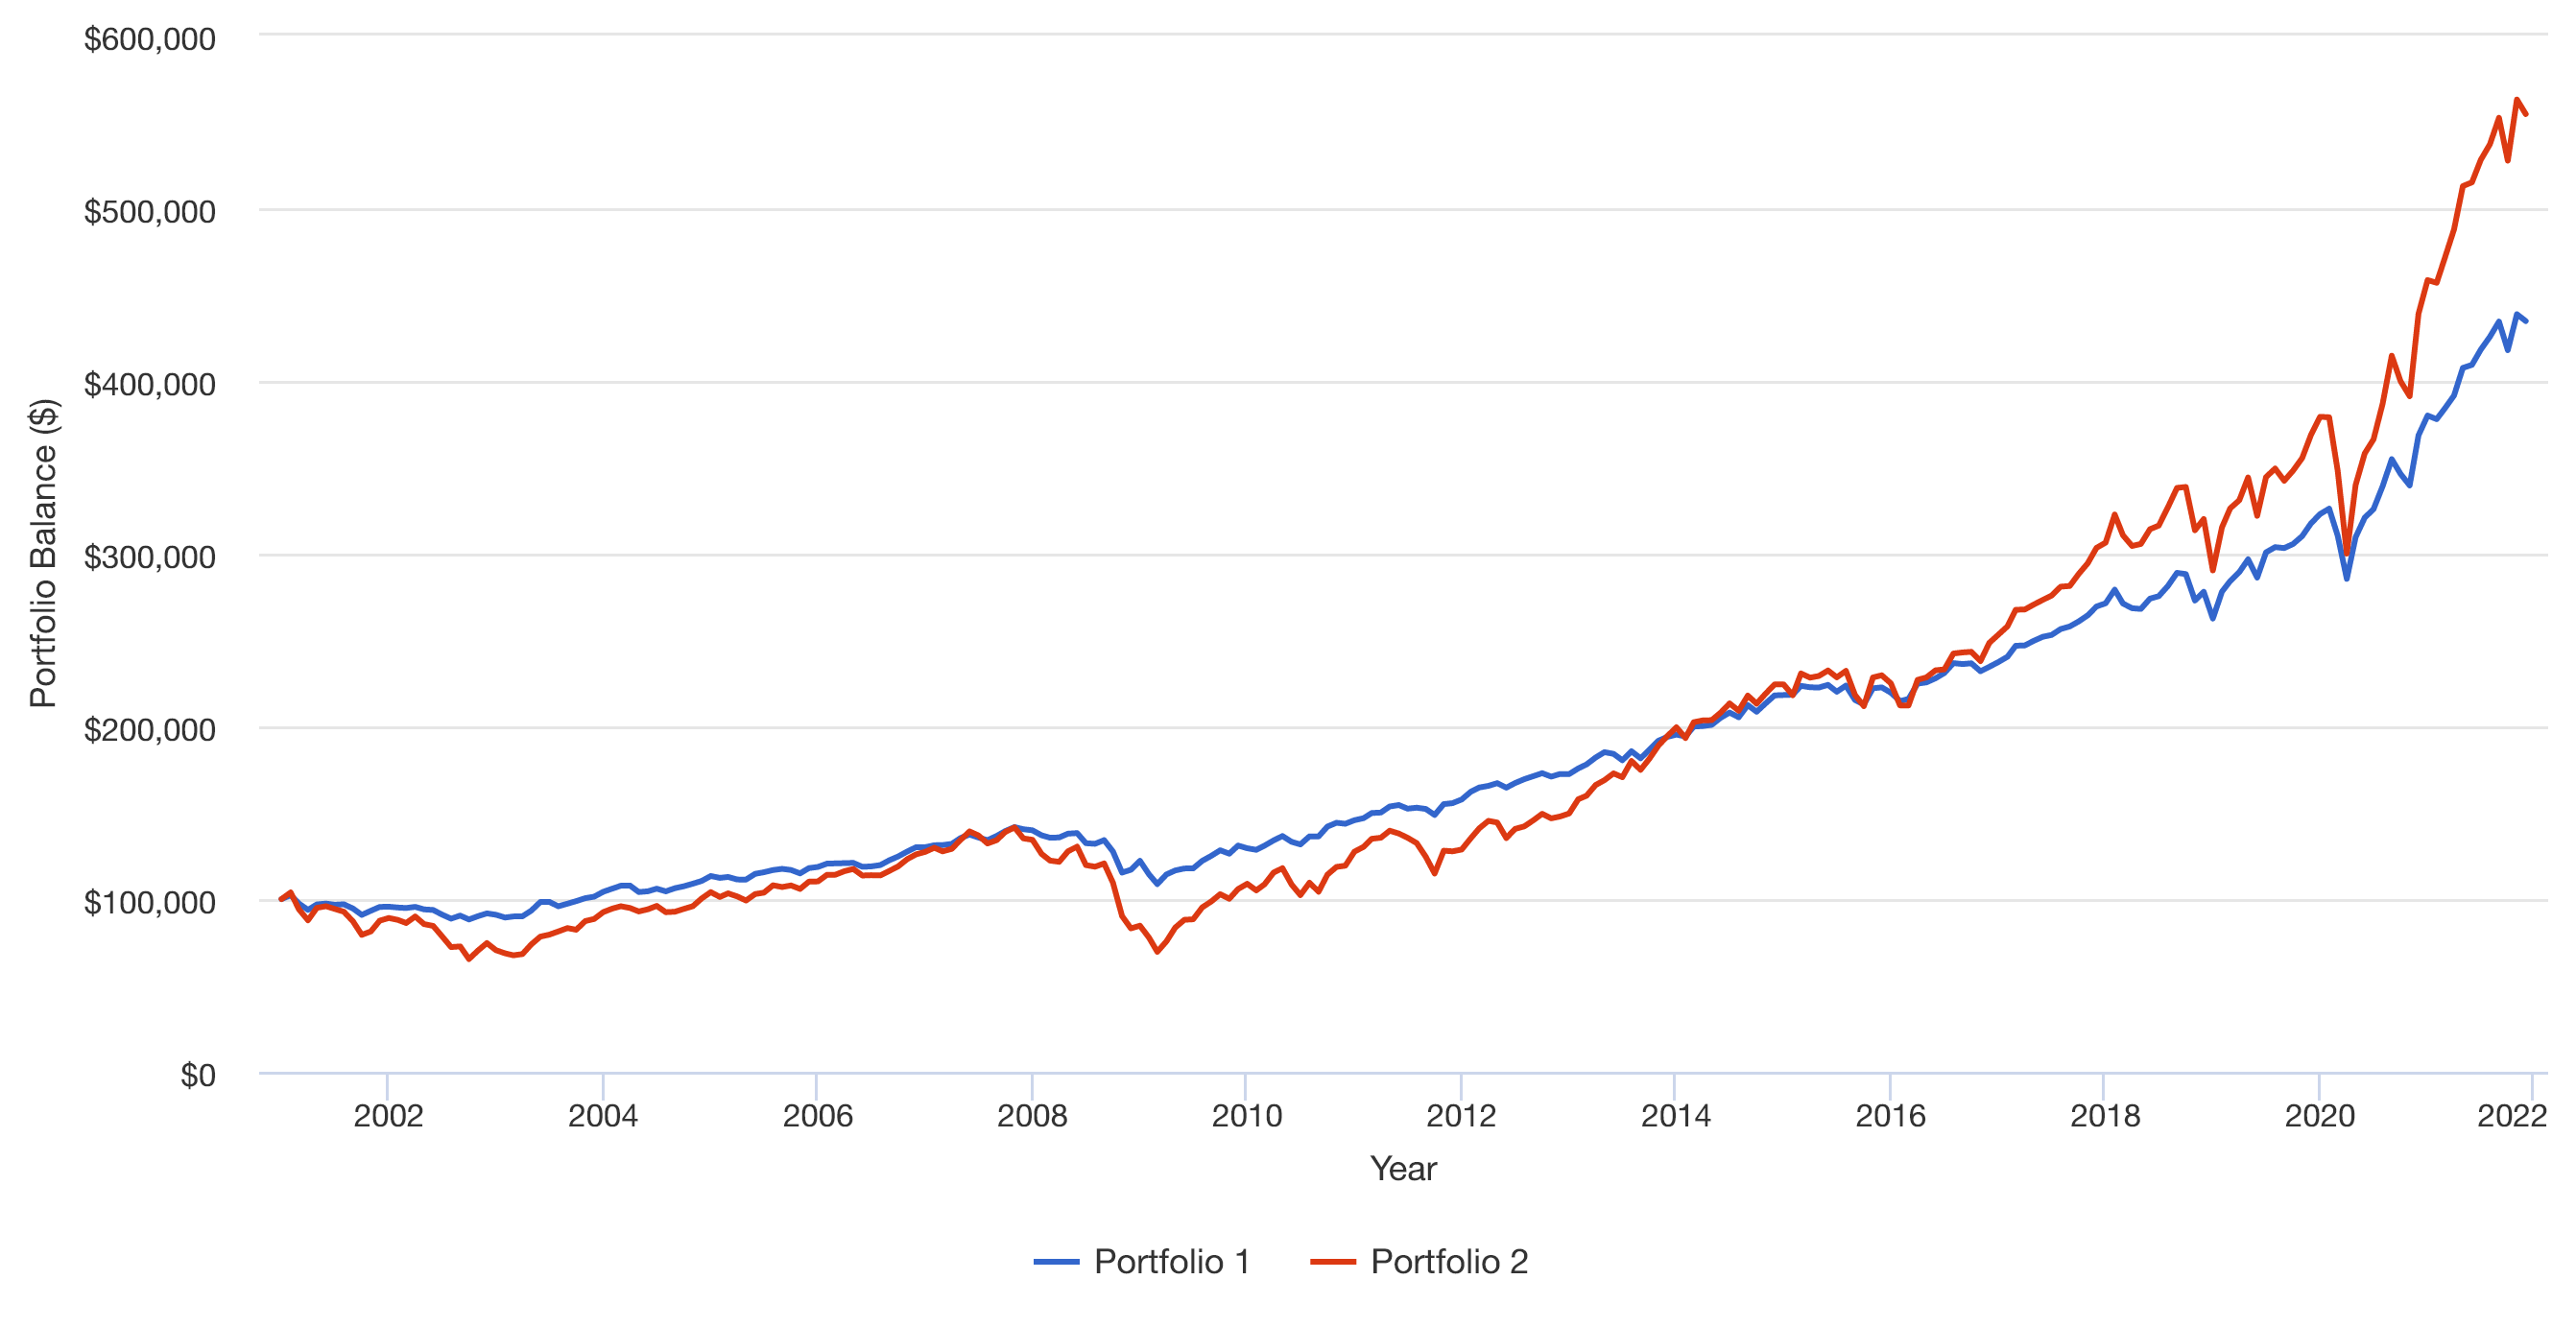
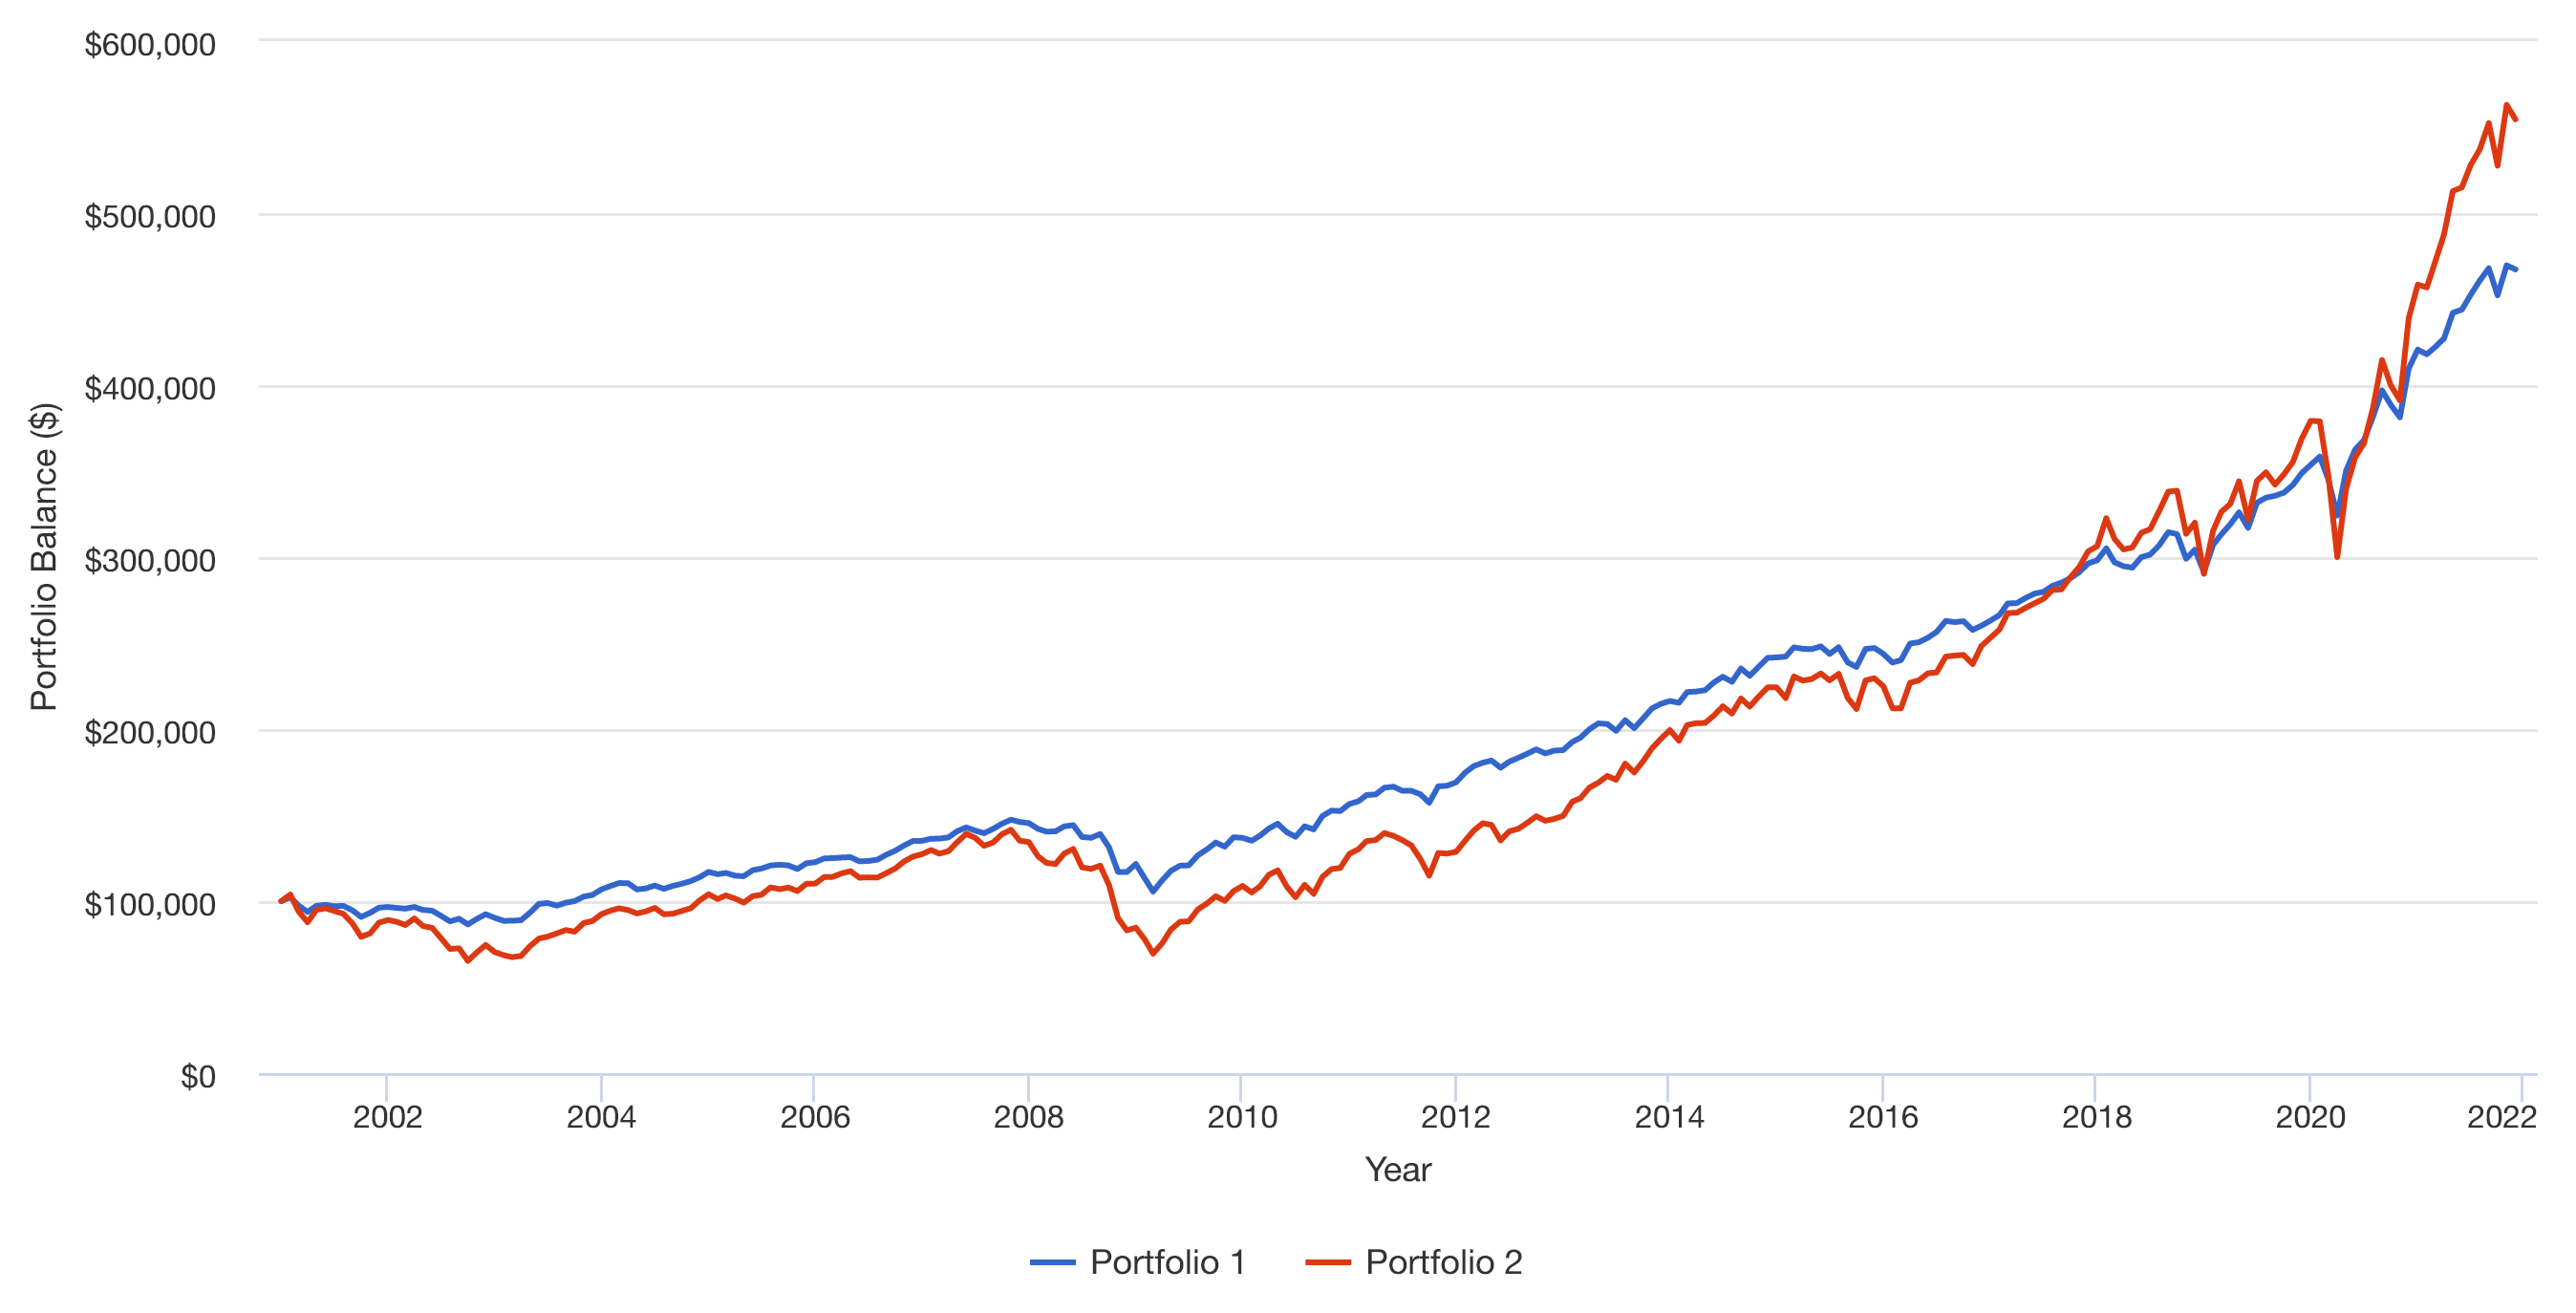
Back to your question #1 and #2. In the following charts:

  • Portfolio 1 represents 60% S&P 500 and 40% 10-year Treasury
  • Portfolio 2 100% S&P 500

Asseume Reinvested Dividend/Interest.

$100k Lump Sum with No Rebalancing = False
enter image description here

$100k Lump Sum with Quarterly Rebalancing = False
enter image description here


I would not spend a minute of my life watching such videos.

2
  • 2
    Nice work. See my own answer. The video make a rookie error, used S&P index, without reinvested dividends. Commented Dec 3, 2021 at 11:17
  • Great follow-ups in the edits. Though it does look like the claim being made by the particular graphic that The Money Guy Show used is inaccurate, this following discussion I think still opened my eyes to the fact that a 60/40 split really isn't as much of a bad thing as I assumed. I used to think that it would be such a shame to switch over to a more conservative portfolio in my old age, since I could miss out on all those big gains! After all the discussion here, it seems that I am really not "missing out" on too much, and rather I'm securing my total value for more comfort. Great research!
    – Flats
    Commented Dec 7, 2021 at 16:22
11

The video authors ignored 2 decades of dividends resulting in a false conclusion

See the index for S&P Total return.

End of Dec 1999 (i.e. Jan 2000) = 2021.40 End of Oct 2021 = 9558.33.

Divide. $100K grows to $475,950

They used just the S&P index and ignored dividends, and it took me seconds to call out their nonsense.

$395K vs $475K is actually worth the trade off if you consider the lower volatility. I just find it unconscionable that their numbers are simply incorrect and only one comment called them out -

You really didn't reinvest dividends in your calculations?? S&P 500 with dividends reinvested has returned 392% not 219% since January of 2000.

3

TL;DR: No comment on whether their conclusion is correct (a particular 60/40 approach outperformed a straight 100% S&P portfolio between January 2000 and November 2021), but their methodology is not clearly articulated (and may or may not be either flawed or intentionally misleading).


They don't mention rebalancing at all in that segment, and that leaves a big question. For a 100% S&P500 portfolio, that doesn't matter. It will always be 100% S&P index fund (unless you are buying the individual stocks and replicating the index yourself). For a 60/40 portfolio (or any non-100% allocation), it really matters. They show this chart:

enter image description here

Assuming no rebalancing, the first row is pretty clear-cut. Start with 100% S&P 500, and the value goes down by 41.1%. Start with a 60/40 split, and the value goes down 18.4% over the same time period. The time period is two years, and people generally rebalance more often than that (how often is appropriate is a matter of opinion, but common choices are quarterly, annually, or 2x/year).

Once they introduce a second row, though, they skip an important point. One portfolio is 100% S&P, but the other is a 60/40. Is this the same 60/40 from the first row (i.e. it was a 60/40 split in January 2000 and was never rebalanced)? If so, it's almost certainly got a different allocation now. Do we rebalance it now to start this new row in their table? Do we then leave it alone for the next 5 years? Is this a new 60/40 portfolio, and we're doing an apples-to-apples comparison where the 100/0 and 60/40 start with the same amount invested at the beginning of this period and never get rebalanced?

One interpretation (which may be entirely wrong but at least what I watched of the segment didn't explain rebalancing, and your question seems to suggest they didn't mention it at all) is that the two portfolios started with the same balance, and the 60/40 portfolio was rebalanced at the beginning of each row. Looking at the irregular time periods the rows represent (ranging from 1 month to over 10 years), I'd say the data was carefully cherry-picked to support a particular conclusion.

Of course, they could be assuming a regular (monthly, annually, or otherwise) rebalancing, but they don't explain that.

2

The video has a low signal-to-noise ratio. Anyone who wants to see what their example really is can just do a freeze frame at 24:14. They don't actually even mention rebalancing during the 5-minute segment you refer to in the question, but you're right, the only way for the mix to outperform both of the individual assets is that the simulation has to have been done using rebalancing. Their mixed portfolio had an average return of 7.1%, which is higher than any bond rate during that period, and is also higher than the 6.0% average return on the S&P during that period. If they hadn't been rebalancing, then the return on the mixed portfolio would have been equal to the weighted average of the two returns, which would have been something like 5%.

When you do rebalancing, the expected return on your portfolio is not simply equal to the weighted average of the expected returns of the different assets (let's say two different assets). If you do rebalancing, then there may be a "rebalancing bonus," which is the amount by which your return exceeds this weighted average. Cases where the RB is large and positive are those in which both asset A and asset B have a lot of variability, and they're inversely correlated with one another. When this condition exists, you have a pretty decent chance of getting situations where A dives super low, while B stays steady. When this happens, rebalancing causes you to use some of B to buy some of A at a really cheap price. It can then happen that A rebounds, and you feel like a genius. If you compare with someone who had their portfolio entirely in A, you have an advantage, because you're able to buy a lot of A when it's low.

In their example, A is the S&P 500, and B is 10-year treasury bonds, and the time period is 2000-2020. With hindsight, rebalancing with a mix of these two assets was an awesome decision during this period. A was basically flat for a decade and then took off like a rocket for a decade. Meanwhile, B did fairly well during the first decade and then started returning zero during the second decade. So we have all the necessary conditions for a big RB: both A and B were highly variable, and A and B were highly anticorrelated.

But look, if you tell me that two assets A and B are going to be anticorrelated, then of course I can make out like a bandit by having that information. The problem is that we don't know that in advance. The people in the video have cherry-picked an example where they know with hindsight that this would have happened.

I assume you also get higher variability with rebalancing than if you simply diversify without rebalancing, although I haven't seen a quantitative analysis of that. That higher variability is a bad thing. A static, mixed portfolio will always have a lower variability than a static, undiversified one.

The video fails to discuss the possible transaction costs and tax consequences associated with rebalancing. They also seem to have assumed that a lump sum was invested in 2000, whereas in reality people would probably be dollar cost averaging. And although they don't say when the rebalancing happened (because they don't mention that there was rebalancing at all), it sounds like they may have pretended that it happened precisely at the times shown on their slide, i.e., they rebalanced by making a huge, perfectly timed buy at the bottom of the 2002 and 2009 crashes. In reality, you'd probably be rebalancing on some fixed time interval, and therefore you wouldn't have made such perfectly timed transactions.

0

someone just sent us this, sorry for the late response! When I updated the graphic for the show, I updated the periods in red and black but the total return was not properly updated (sorry about that!). The periods in red and black were essentially correct, but I went back and updated the dates of the returns to make sure they were consistent and they changed slightly. The total return changed a lot, but the result was the same: the 60/40 beat the S&P 500 over this period of time. The allocation stayed at a constant 60/40 the entire time, so essentially constant rebalancing - but we'll just say they were invested in an ETF that held 60% S&P 500 and 40% 10-Year Treasury.

This slide is not arguing that everyone should have a 60/40 portfolio, or that a conservative portfolio is more appropriate for younger investors, or even that the expected return of the S&P 500 is less than a 60/40 over time. The slide is meant to show the importance of diversification, particularly for someone close to retirement. That's why we used a lump sum $100,000 initial investment instead of DCAing. We kept it simple and didn't assume they were taking distributions, didn't look at tax consequences, just looked at total return. For the return of the S&P 500 we used adjusted return values for SPY, pulled from Yahoo Finance. Dividends and splits are included. We got 10-Year Treasury data from MacroTrends. Using a different bond index like AGG might have slightly increased the returns of the 60/40 portfolio. I haven't run the numbers for that, but just glanced at Barclays Agg returns since 2000 (https://www.thebalance.com/stocks-and-bonds-calendar-year-performance-417028) and they look higher than the 10-Year Treasury for most years.

Attached is the updated slide. Sorry for the mistake, and thank you to everyone out there that pointed it out to us!

  • FTE Daniel from The Money Guy Show

Diversification is Disappointing but Awesome!

12
  • Always cool to see a response from the source mentioned in a question. Curious as to what the thoughts are from the previous answerers on your input here.
    – Flats
    Commented Dec 6, 2021 at 17:26
  • I am unable to replicate such returns using any index or ETF. Please post an Excel showing your intermediate steps, including how you derive the price of 10-year treasury from the Yield to Maturity. Furthermore, "constant rebalancing" is not achievable, please try monthly rebalancing.
    – base64
    Commented Dec 6, 2021 at 17:57
  • 1
    For simpicity, please just demonstrate that MAR2020 to NOV2021 return for the "60/40" is 64.6% instead of 33% return that I calculated using 60% SPY 28% IEF 12% TLH with monthly rebalancing.
    – base64
    Commented Dec 6, 2021 at 18:02
  • "adjusted return values for SPY" 2MAR2020 was 300.48, 30NOV2021 455.56. All from Yahoo Finance. How exactly do you get 106.6%?
    – base64
    Commented Dec 6, 2021 at 18:13
  • 2
    You've repeated your conclusion, but the data shows otherwise. Please share your data and intermediate steps. Would you simply give it a try at 60% SPY 28% IEF 12% TLH instead of Yield to Maturity, just for MAR2020 to NOV2021?
    – base64
    Commented Dec 6, 2021 at 19:09
-2

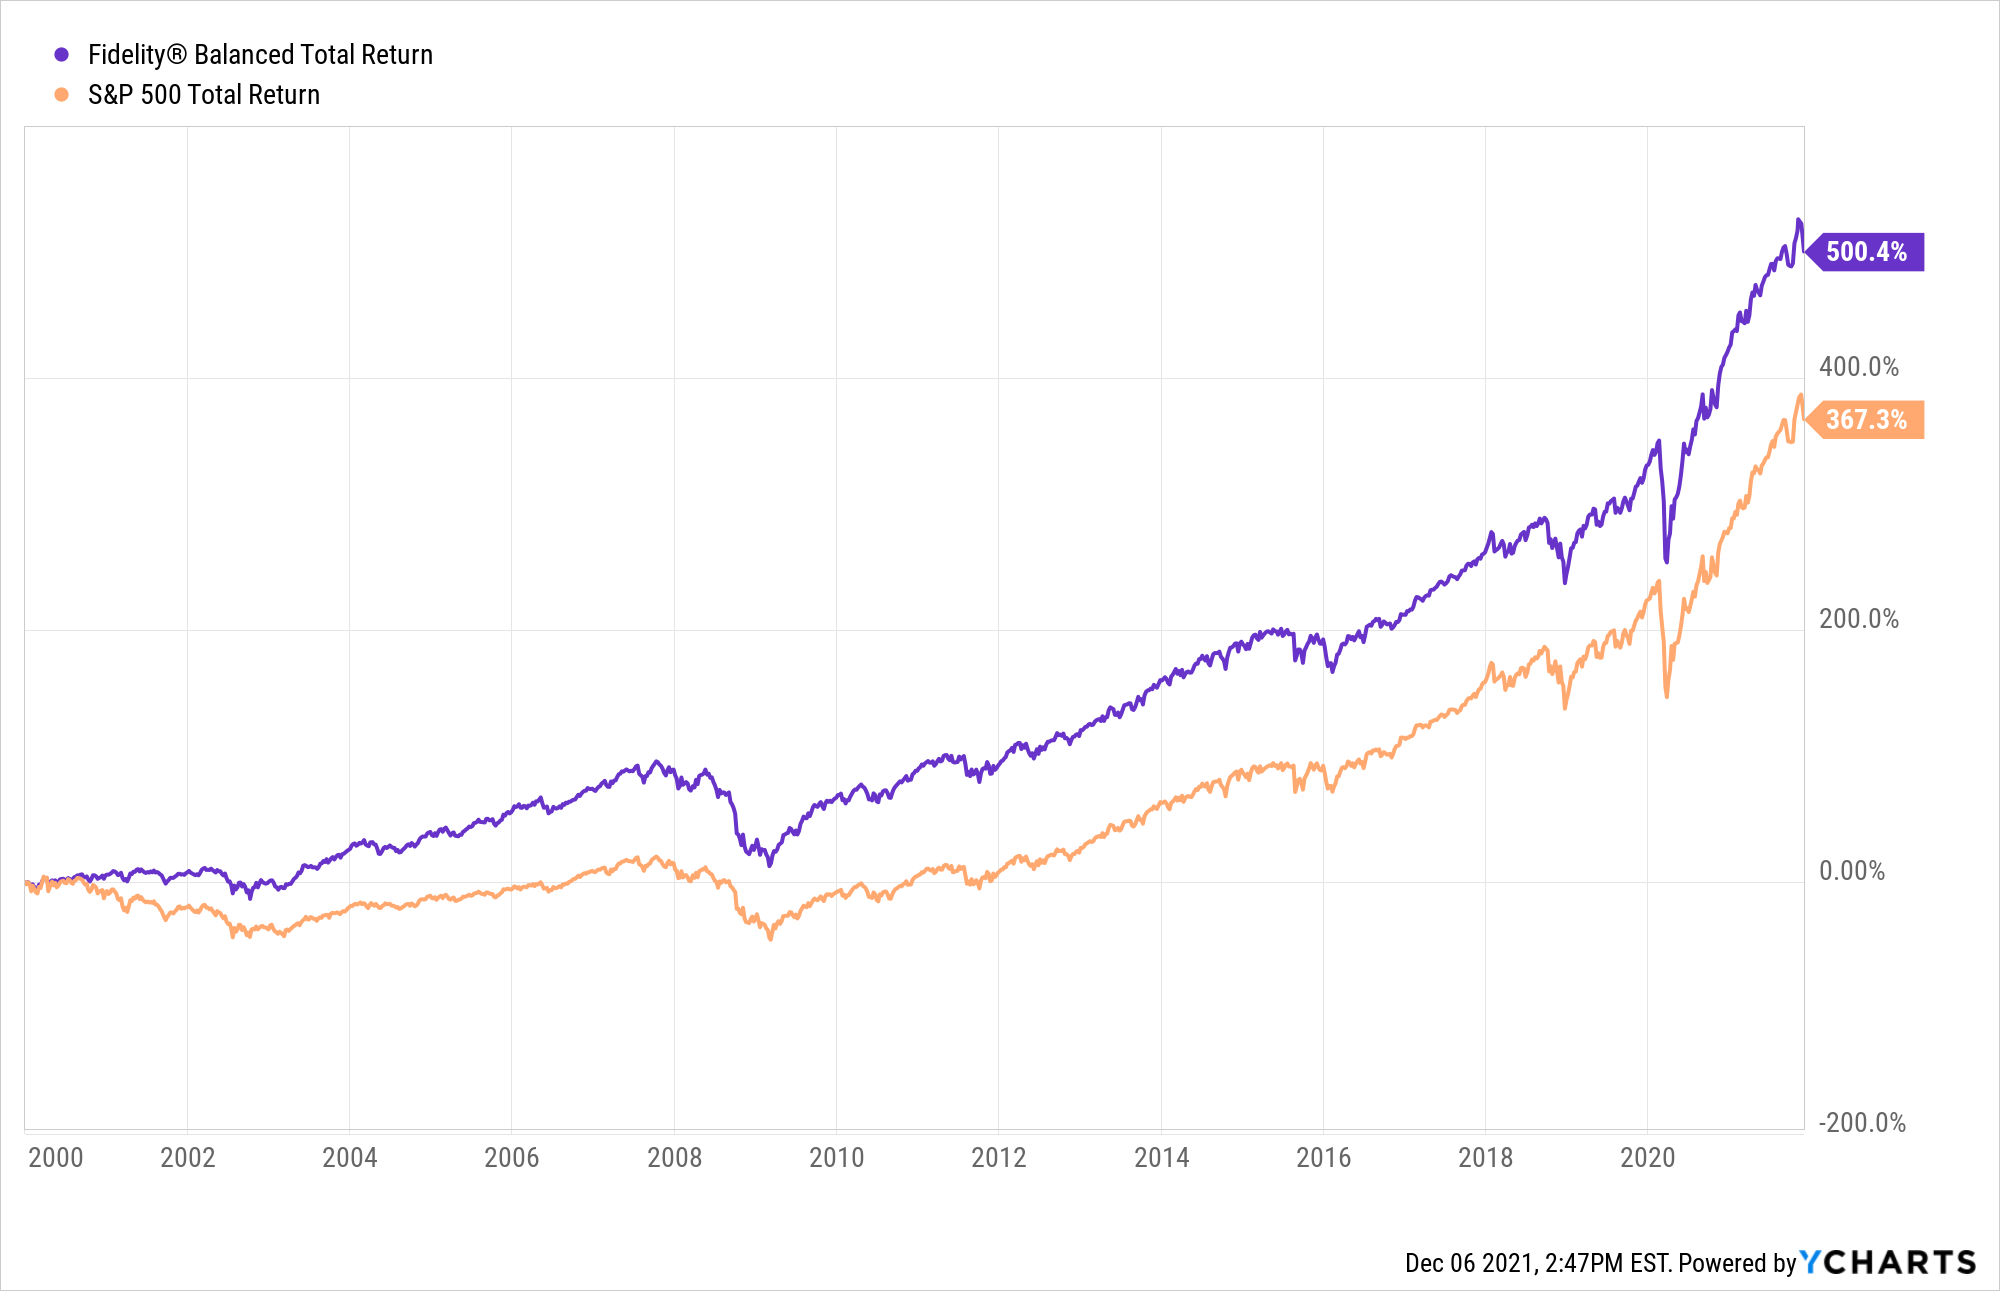
Here's a more real-life example showing a Fidelity 60/40 fund vs. the S&P 500 from Jan 1, 2000 to Dec 1, 2021.

Fidelity Balanced vs. S&P 500

8
  • 1
    Even today, FBALX is is 73% Active Equity, 27% Bonds fund. It neither contains S&P 500 nor it is 60/40.
    – base64
    Commented Dec 6, 2021 at 20:11
  • 1
    It is not ideal to cherry pick Active Equities. For all I know, they could have 50% bonds at 2000 and moved more into QQQ equivalent. I presented to you actual funds that represent 60/40, the model 60/40 based on Modern portfolio theory by Nobel Economist. I also presented actual Treasury ETFs that represented 10-year. I have yet to see the Excel supporting your original claim, nor how you can achieve 64.6% MAR2020 to NOV2021 return for the "60/40", nor how you can achieve 106.6% for SPY in the same small period.
    – base64
    Commented Dec 6, 2021 at 20:39
  • 1
    I provided sources and dates for our data - 10-Year Treasury from macrotrends.net/2016/10-year-treasury-bond-rate-yield-chart and SPY adjusted close from Yahoo Finance. Value on Mar 23, 2020 = 218.02. Value on Dec 1, 2021 = 450.50. That's a return of 106.6%. Again, we didn't always measure from the 1st of every month since we were trying to show bull and bear markets. But it makes absolutely no difference in the total overall return because 1) it is a lump sum invested on Jan 1, 2000 and no additional investments and 2) the time period is the same, Jan 1, 2000 to Dec 1, 2021.
    – Daniel May
    Commented Dec 6, 2021 at 20:48
  • 1
    I have edited my original answer, please fiddle with the Excel file: mediafire.com/file/p34fe2y7td4dchx/6040_vs_SPY.xlsx/file
    – base64
    Commented Dec 6, 2021 at 21:57
  • 1
    @base64 - I wonder how many active funds have a similar description of their investment mix, and what the range of returns is. The premise was a pure 60/40 S&P/treasury mix, not this nonsensical backpedaling. I’m sure there exists some decades where the 60/40 beat the S&P, but not these two decades. Commented Dec 7, 2021 at 0:40

You must log in to answer this question.

Not the answer you're looking for? Browse other questions tagged .