I am trying out tiingo API and made the following call:
headers = {
    'Content-Type': 'application/json'
}
requestResponse = requests.get("https://api.tiingo.com/tiingo/daily/aapl/prices?startDate=2019-01-01&endDate=2021-06-26&token=bcf142701e620cf52e79a7238d60da5c3f0a21dc", headers=headers)
aapl = pd.DataFrame(requestResponse.json())
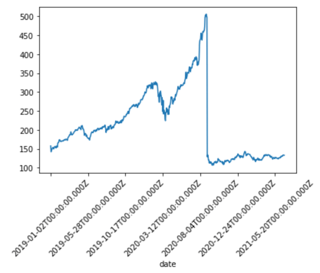
Next, I plotted the "close" data:
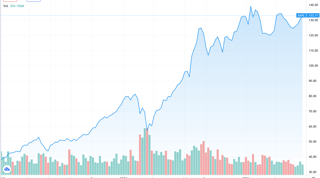
This doesn't look at all like the graph of AAPL (source tradingview):
What am I missing here?


