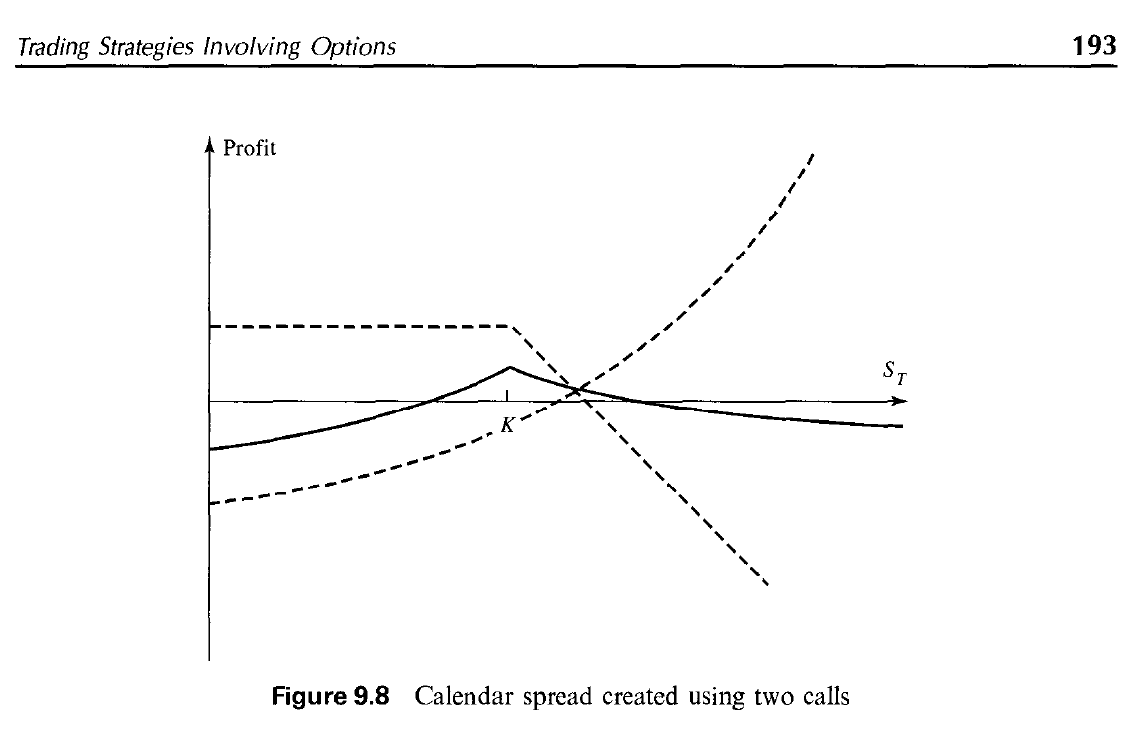
The following plot and its context were taken from Hull`s Options, Futures and Other Derivative Securities (2002).
I am slowly getting the basics of financial mathematics and came across this plot that shows a Calendar Spread built with call options. The example considers two call options with same strike price K and two different maturity dates, T1 and T2, where 0 < T1 < T2.
Assuming the dotted line that drops after the stock price reaches K represents Call Option 1 (K, T1), my question is: why is the other dotted line curvilinear?
I've seen the plots for Call Spread Inequality, Put Spread, Butterfly, and some others, and this is the first time that the line showing the outcome of an option is not made of straight lines.
I was thinking - maybe this has to do with the fact that working with different maturities T1 and T2, perhaps T2 is also affected not only by the stock price, but also by how far/how close it is to expiring. If so, shouldn't this be a factor also for Option 1?

