20

For most well-developed countries, indexes of their stock markets tend to grow in the very long term. For example, look up a long-term graph of the FTSE100 or the S&P500. For Japan's Nikkei 225, this does not appear to be the case. A simple inspection of its graph from the early 90's to today seems to show that although it does occasionally go up, it's almost always followed by a drop of comparable or greater size.

Why is this? What financial troubles have caused Japan's market to trend downwards over the past 30 or so years? I'm vaguely aware of their current economic troubles, but I don't see why that would result in a market that appears to have brief periods of growth. If anything, I'd expect their recent economic history to produce a market that goes straight down, rather than inconsistently hovering back up.

2
  • 3
    you may want to search references on "secular stagnation", which suggest that what has happened to Japan could be happening to other advanced economies in Europe and America.
    – PatrickT
    Commented Mar 31, 2020 at 8:06
  • Byt the same criterion, european stock indexes appear to be bad investments too (etfs such as EWG [germany], EWQ [France], EWI [italy], EWP [spain]). As does Brazil (ewz), Mexico [eww] China [fxi], and a host of others. In fact, you might more productively ask what about American style capitalism makes it so beneficial to shareholders on an excluding dividend based basis.
    – user189035
    Commented Apr 1, 2020 at 12:16

2 Answers 2

26

The Japanese economy has had a unique history, with a huge bubble in the 1980s and a long unwinding afterward.

I don't see why that would result in a market that appears to have brief periods of growth. If anything, I'd expect their recent economic history to produce a market that goes straight down, rather than inconsistently hovering back up.

Apart from specifics of Japan, this confusion can be addressed via general principles of markets. No market can literally head "straight down" for an extended period, because if there were such a predictable pattern, intelligent traders would "front-run" by selling and shorting so much that the expected decline would happen "all at once".

According to the efficient market hypothesis, the market discounts all available information and its movements are driven only by new information (the deviation from previous expectations). The market is inherently two-sided; at any given time, there are reasonable bets for it to go up as well as down, or it would not be at the price it is.

Once a piece of bad news becomes known, the corresponding market decline is immediate rather than gradual. At that point, the projections are "baked in", and any subsequent updates that raise a bit of hope ("slightly less bad") will cause a market rally. Market movements always look something like a random walk (Brownian motion) because prices would not be equilibrium if they did not have the potential to go up as well as down.

In the case of Japan, you see many rallies and declines over the years as recovery hopes waxed and waned. Overall, the trend continued down as economic projections met with disappointment more often than not.

2

Nanoman explained the Lost Decade, and that explains the period from the late 1980s through around 2003; massive growth (that was far more than it should have been) followed by a massive collapse both due to that being a bubble, and demographic pressures that still exist today.

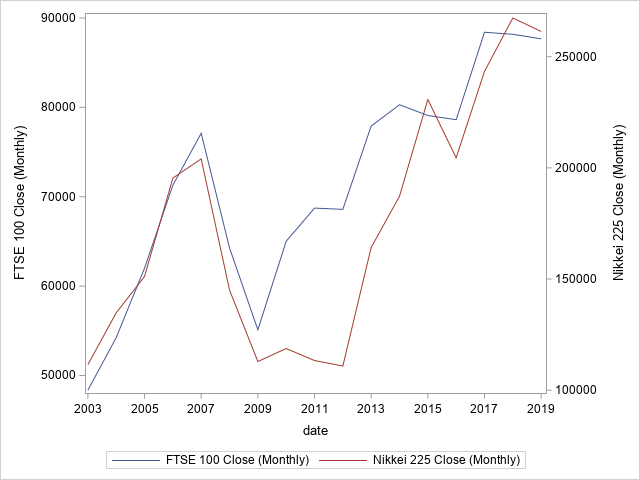
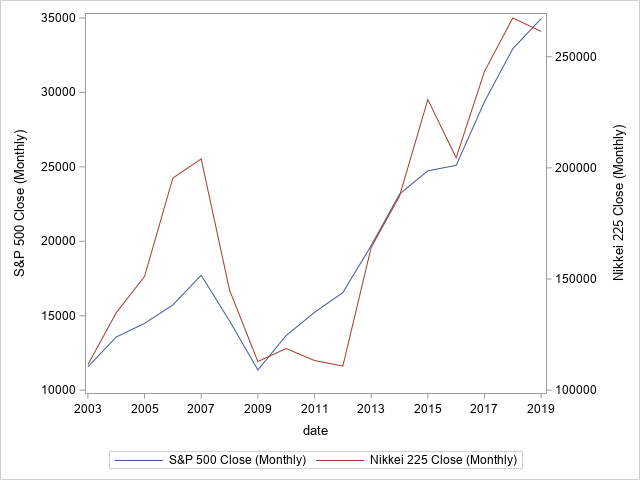
However, the period after 2003 is not really particularly similar. Starting around 2003 (and perhaps earlier, but 2003 is a good starting point; it's just after the 2001-2002 downturn), the Nikkei 225 and the S&P 500 track very closely to each other, with the Nikkei having slightly more volatility, but really being quite close in relative value overall. The 2006-2007 bubble was slightly more pronounced for the Nikkei, but was still quite similar overall; both the Nikkei and S&P in 2009 returned to approximately their 2003 starting point, and while the Nikkei took a little longer to recover from that, it recovered in a very similar manner.

Look at the chart below; this is the closing price on the first day of each month for the two markets, plotted over the top of each other (S&P price is on left, Nikkei on right). Those are reasonably similar results, in my opinion, and nothing to consider dramatically different. Japan does have some challenges that are unique to it, but this is a market like any other.

The chart for the FTSE 100 vs the Nikkei would look even more similar - they both have a similar size spike around 2006ish, and then drop back; FTSE also recovers a bit faster, but again they basically overlap again by 2015.

S&P 500 vs Nikkei 225 chart

FTSE vs Nikkei 225 chart

7
  • These charts aren't accounting for the dividends paid by these stocks.
    – ahaas
    Commented Apr 3, 2020 at 3:22
  • 1
    @ahaas These are the major indices of each country; not sure why dividends would make a significant difference here.
    – Joe
    Commented Apr 3, 2020 at 4:24
  • 1
    If you don't account for the dividends paid out, you will be missing a significant part of what makes an investment "good". One does not make money only from capital gains.
    – ahaas
    Commented Apr 3, 2020 at 23:27
  • Sure, but is there a significant difference in the dividend payouts of the many component stocks in these major stock indexes?
    – Joe
    Commented Apr 3, 2020 at 23:53
  • Actually, scratch that. At least for the S&P, and I suspect for others, dividends are baked into the index. investopedia.com/ask/answers/040915/…
    – Joe
    Commented Apr 4, 2020 at 0:05

You must log in to answer this question.

Not the answer you're looking for? Browse other questions tagged .